
Figure 1.
- ID
- ZDB-FIG-211201-238
- Publication
- Montijn et al., 2021 - A parameter-free statistical test for neuronal responsiveness
- Other Figures
- All Figure Page
- Back to All Figure Page
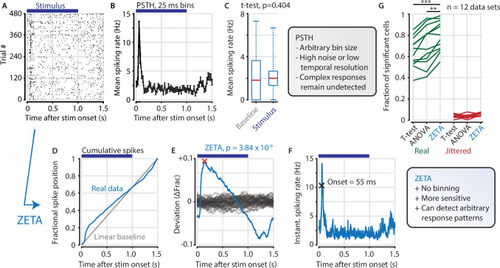
(A,B) Raster plot (A) and PSTH (B) for a neuron that shows an onset peak and a reduced sustained spiking in response to a visual stimulus (purple bars). (C) A common approach for computing a neuron’s responsiveness is to perform a t-test on the average activity per trial during stimulus presence (0–1 s) and absence (1.0–1.5 s), which fails to detect this neuron’s response (paired t-test, p = 0.404, n = 480 trials). (D) ZETA avoids binning, by using the spike times to construct a fractional position for each spike (blue) and compares this with a null-distribution of a stationary rate (grey). (E) The difference between the real and null curves gives a deviation from expectation (blue), where the most extreme value is defined as the Zenith of Event-based Time-locked Anomalies (ZETA, red cross). To compute its statistical significance (here, p = 3.84 × 10⁻⁹), we compare ZETA to the variability over repeats of the procedure with jittered onsets (grey curves). (F) A ZETA-derived instantaneous spiking rate allows a reliable estimation of response onset. (G) At a significance threshold of α = 0.05, ZETA detects more stimulus-responsive cells than both a mean-rate t-test (***: paired t-test, p = 2.8 x 10⁻⁷, n = 12 data sets) and an ANOVA over bins using an optimal bin width (**: p = 0.0014).
|