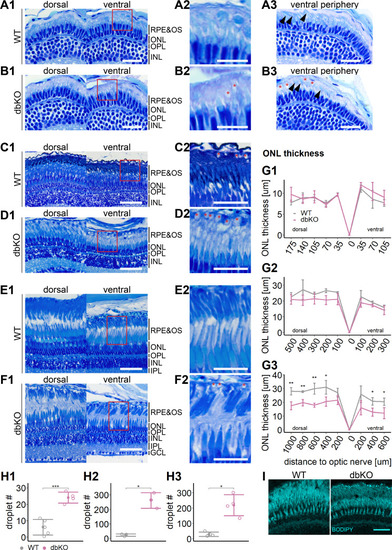
(A1–F1) Central retinal semithin plastic sections (dorsal and ventral of the optic nerve) of wild type (WT) and double-KO 5 days postfertilization (dpf) larvae (A, B), 1-month-old juveniles (C, D), and adults (E, F). (A2–F2) Closeup of area in red box. Subretinal lipid deposits in double-KO retinas are found already at 5 dpf and increase in number with age. Occasionally, these structures are found in wild-type controls. Black arrows: rod outer segments. Red star: subretinal lipid deposits. (A3, B3) Ventral peripheral retina. Black arrows indicate rod outer segments. These are less abundant, but not completely absent in double-KO retinas. (G) Quantification of outer nuclear layer (ONL) thickness in 5 dpf (G1), 1-month-old (G2), and adult (G3) retinas. Data are from n ≥ 3 biological replicates per genotype and age. Shown is the mean ± SD at specified distances from the optic nerve in central retinal sections (dorsal and ventral). Effect of genotype on ONL thickness (repeated-measures analysis of variance [ANOVA]) at 5 dpf (G1) [F(1,7) = 3.701, p = 0.096], at 1 month (G2) [F(1,4) = 4.459, p = 0.102], and in adults (G3) [F(1,6) = 44.074, p < 0.001]. Pairwise comparisons of dbKO vs. WT by region were calculated with Benjamini–Hochberg correction for multiple comparisons. (H) Quantification of the number of lipid droplets throughout a central retinal section in 5 dpf (H1), 1-month-old (H2), and adult (H3) retinas. Comparison of double-KO vs. wild type was performed using t-test: (H1) [t(6.94) = −6.72, p < 0.001], (H2) [t(2.08) = −7.65, p = 0.015], and (H3) [t(3.25) = −5.39, p = 0.0102]. Individual data points (open circles) from n ≥ 3 biological replicates per genotype and age are shown with mean ± standard deviation (SD). (I) Staining for neutral lipids with BODIPY TR methyl ester confirms accumulation of lipid droplets in the subretinal space of the double-KO retina. The example shows adult retinas of the respective genotype. Significance levels depicted as asterisks: *p < 0.05, **p < 0.01, ***p < 0.001. Scale bars: (A1, A3, B1, B3) 20 μm, (A2, B2) 10 μm, (C1–F1) 50 μm, (C2–F2) 25 μm, and (I) 10 μm. See Figure 7—source data 1 for measurements in G and H.