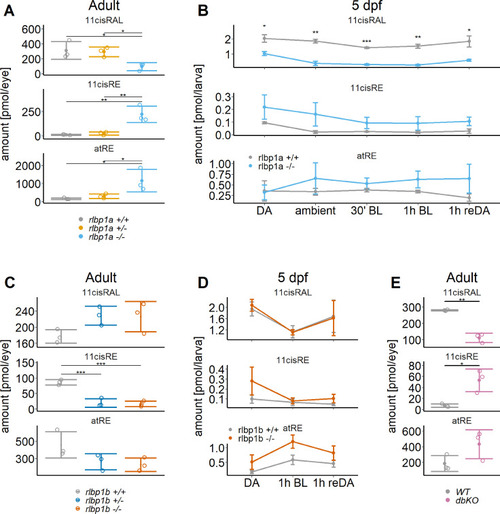
Retinoid content of adult eyes (A, C, E) or whole larvae (B, D), determined by high-performance liquid chromatography (HPLC) analysis. (A, C, E) Adults: samples were collected in ambient light. For each knockout (KO) line, 11cisRAL, 11cisRE, and atRE levels were determined. Data from n = 3 individual samples per genotype are shown with their respective mean ± standard deviation (SD). (A) rlbp1a-KO line: one-way analysis of variance (ANOVA) revealed a significant effect of genotype on the amount of retinoids for 11cisRAL [F(2,6) = 6.215, p = 0.035], 11cisRE [F(2,6) = 17.328, p = 0.003], and atRE [F(2,6) = 6.526, p = 0.031]. (C) rlbp1b-KO line: genotype had an effect on 11cisRE levels (one-way ANOVA) [F(2,6) = 40.774, p < 0.001], but less so on 11cisRAL [F(2,6) = 3.378, p = 0.104] and atRE [F(2,6) = 3.676, p = 0.091]. (E) double-KO line. 11cisRAL is reduced in dbKO [t(4) = 10.2, p = 0.0005]. The retinyl esters 11cisRE [t(4) = −3.84, p = 0.018] and atRE [t(4) = −2.04, p = 0.112] accumulate (Student’s t-test). (B, D) Larvae: single-KO larvae (n = 3 samples per genotype and condition, where one sample equals 100 larvae per condition and genotype) were collected after exposure to different light conditions (DA: dark-adapted; ambient: ambient light; 30’ BL: 30 min exposure to bleaching light at 20’000 lux; 1 hr BL: 1 hr exposure to 20’000 lux; 1 hr reDA: 1 hr at 20’000 lux after wich the larvae were allowed to redark adapt for 1 hr). Samples were collected in three independent experiments per KO line and data for 11cisRAL, 11cisRE, and atRE levels are shown as mean ± SD and the main effect of genotype on the amount of retinoids was calculated with two-way ANOVA. (B) In rlbp1a−/− larvae11cisRAL levels are reduced [F(1,28) = 85.51, p < 0.001] whereas retinyl esters 11cisRE [F(1,28) = 9.84, p = 0.004] and atRE [F(1,28) = 4.133, p = 0.052] are slightly elevated. (D) 11cisRAL regeneration in rlbp1b−/− larvae is not affected [F(1,16) = 0.003, p = 0.96] and 11cisRE levels are comparable to rlbp1b+/+ larvae [F(1,16) = 2.246, p = 0.153]. The amount of atRE is slightly elevated [F(1,16) = 6.05, p = 0.026]. Pairwise comparisons to the respective control were performed with Benjamini–Hochberg correction for multiple testing. Significance levels are indicated by asterisks. p ≥ 0.05 is not shown. *p < 0.05, **p < 0.01, ***p < 0.001. See Figure 2—source data 1 for retinoid measurements.