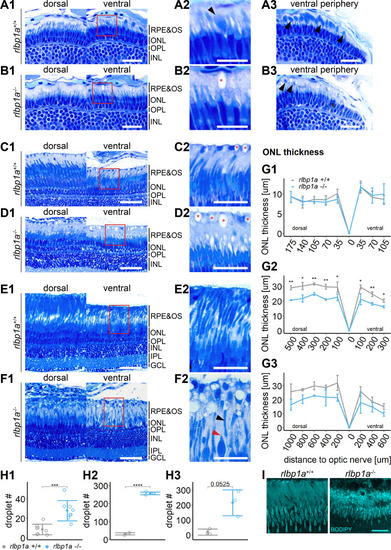
(A1–F1) Central retinal semithin plastic sections (dorsal and ventral of the optic nerve) of rlbp1a+/+ and rlbp1a−/− 5 dpf larvae (A, B), 1-month-old juveniles (C, D), and adults (E, F). (A2–F2) Closeup of area in red box. Subretinal lipid deposits in rlbp1a−/− retinas are found already at 5 days postfertilization (dpf) and increase in number and size with age. Occasionally, these structures are found in wild-type controls, but are usually smaller in size. Black arrows: rod outer segments. Red star: subretinal lipid deposits. Red arrow: missing cone outer segment. (A3, B3) Ventral peripheral retina. Black arrows indicate rod outer segments. These are less abundant, but not completely absent in KO retinas. (G) Quantification of outer nuclear layer (ONL) thickness central retinal sections in 5 dpf (G1), 1-month-old (G2), and adult (G3) retinas. Data are from n ≥ 3 biological replicates per genotype and age. Shown is the mean ± standard deviation (SD) at specified distances from the optic nerve (dorsal and ventral). Effect of genotype on ONL thickness (repeated-measures analysis of variance [ANOVA]) at 5 dpf (G1) [F(1,16) = 0.029, p = 0.87], at 1 month (G2) [F(1,4) = 144.518, p < 0.001], and in adults (G3) [F(1,4) = 18.642, p = 0.012]. Pairwise comparisons of rlbp1a−/− vs. rlbp1a+/+ by region were calculated with Benjamini–Hochberg correction for multiple comparisons. (H) Quantification of the number of lipid droplets in 5 dpf (H1), 1-month-old (H2), and adult (H3) retinas. Comparison of rlbp1a−/− vs. rlbp1a+/+ was performed using t-test: (H1) [t(10.5) = −4.61, p < 0.001], (H2) [t(4.87) = −43.2, p < 0.001], and (H3) [t(2.21) = −3.83, p = 0.0525]. Individual data points (open circles) from n ≥ 3 biological replicates per genotype and age are shown with mean ± SD. (I) Staining for neutral lipids with BODIPY TR methyl ester confirms disturbed outer segment morphology and accumulation of lipid droplets in the subretinal space of rlbp1a−/− retina. The example shows adult retinas of the respective genotype. Significance levels depicted as asterisks: *p < 0.05, **p < 0.01, ***p < 0.001, ****p < 0.0001. Scale bars: (A1, A3, B1, B3) 20 μm, (A2, B2) 10 μm, (C1–F1) 50 μm, (C2–F2) 25 μm, and (I) 10 μm. See Figure 5—source data 1 for measurements in G and H.