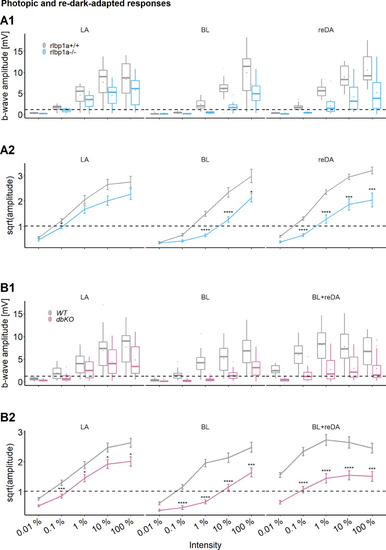
Photopic and redark-adapted electroretinogram (ERG) responses at 5 days postfertilization (dpf). (A1, B1) Data are shown as boxplots of the b-wave amplitude with the box depicting the interquartile range (IQR), whiskers are 1.5 × IQR, mean is shown as diamond, median as horizontal line in the box and outliers are points outside of 1.5 × IQR. Responses were probed at five increasing light intensities and under different background illumination. LA: light-adapted, no dark adaptation before measurements and background illumination during recordings. BL: recordings immediately after 1 hr exposure to bleaching light at 20’000 lux. reDA: recordings after bleaching and 1 hr redark adaptation. Dotted lines depict the mean responses of wild-type controls after dark adaptation at 0.01 % light intensity to illustrate the shift in sensitivity under photopic conditions. Data were collected in N ≥ 3 independent experiments and from total n = 15 larvae per genotype and light condition (A: rlbp1a-knockout [KO] line), or n ≥ 20 larvae per genotype and light condition (B: double-KO line). (A2, B2) Data are shown as mean ± standard error of the mean (SEM). (A2) Left panel: light-adapted responses of rlbp1a−/− vs. rlbp1a+/+. Repeated-measures analysis of variance (ANOVA) revealed a significant effect for genotype on b-wave amplitude [F(1,112) = 13.476, p < 0.001]. Middle panel: responses after a bleach. Effect of genotype: [F(1,84) = 47.908, p < 0.001]. Right panel: responses after bleach and redark adaptation. Effect of genotype: [F(1,112) = 81.267, p < 0.001]. (B2) Left panel: light-adapted responses of dbKO vs. wild type (WT). Effect of genotype: [F(1,236) = 32.633, p < 0.001]. Middle panel: responses after a bleach. Effect of genotype: [F(1,172) = 125.858, p < 0.001]. Right panel: responses after bleach and redark adaptation. Effect of genotype: [F(1,168) = 106.625, p < 0.001]. Statistical analysis was performed on data in (A2, B2) after square root transformation to mitigate the impact of outliers. Only intensity levels where wild-type values were above the dark-adapted threshold were considered in the analysis. Pairwise comparisons between WT and mutants at each light intensity were computed and corrected for multiple testing using the Benjamini–Hochberg correction. Significance levels of pairwise comparisons depicted as asterisks: *p < 0.05, ***p < 0.001, ****p < 0.0001. See Figure 4—source data 1for b-wave amplitudes.