
Fig. 5
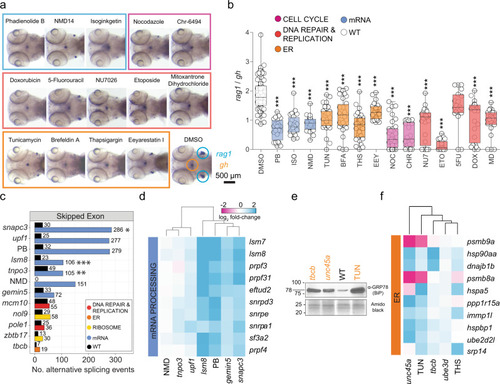
a Representative images at 5 d.p.f. after whole-mount RNA in situ hybridization with rag1- and gh-specific probes for wild-type fish treated with small molecule inhibitors targeting the major pathways impaired by mutant genes. Fish were exposed to drugs between 3 and 5 d.p.f.; DMSO-treated fish were used as negative controls. b rag1/gh ratios of untreated fish (DMSO) and those treated with small molecule inhibitors between 3 and 5 d.p.f. Significance was determined by one-way ANOVA with Dunnett’s post-test. *P < 0.05; **P < 0.01; ***P < 0.001. Abbreviations: 5-fluorouracil (5FU [200 μM]), brefeldin A (BFA [0.75 μM]), Chr-6494 (CHR [0.75 μM]), doxorubicin (DOX [0.75 μM]), eeyarestatin (EEY [800 μM]), etoposide (ETO [1.72 μM]), isoginkgetin (ISO [320 μM]), mitoxantrone dihydrochloride (MD [1.5 μM]), NMD14 (NMD [100 μM]), nocodazole (NOC [0.4 μM]), NU7026 (NU7 [7.5 μM]), pladienolide B (PB [0.2 μM]), thapsigargin (THS [0.5 μM]), and tunicamycin (TUN [1.5 μM]). The concentrations used are indicated in square brackets after the abbrevaitions. See source data file for b in Supplementary Data 2. c Effect of small molecule spliceosome inhibitor (PB) and an inhibitor of non-sense mediated decay (NMD14), on pre-mRNA processing, compared to defects in mutants. Numbers of significant skipped exon events are depicted atop each bar, as determined by reads covering exon boundaries; FDR ≤ 0.05, |inclusion level difference | ≥ 0.250) relative to wild-type siblings. *P < 0.05; **P < 0.01; ***P < 0.001. d PB and NMD14 mimic the effects of mutants acting in pre-mRNA processing pathways. Gene expression patterns of top DEG known to regulate mRNA processing as defined by KEGG pathway IDs (spliceosome—dre03040, mRNA surveillance—dre03015, nonsense-mediated decay—dre03015) are depicted; genetic variants and treatment cohorts are shown in columns and DEG in rows. e The small molecule ER inhibitor, TUN, mimics the proteomic and transcriptional ER stress response observed in mutants. A Western blot of protein lysates of 5 d.p.f. zebrafish mutants/treatment cohorts were resolved with antibodies detecting the ER stress-related component GRP78 (BiP). Amido black staining of total protein was used as a loading control. Tunicamycin (TUN)-treated wild-type fish were included as positive control of ER stress activation. Sizes of markers are indicated in kDa. f Small molecule ER inhibitors, TUN and THS, mimic differential gene expression patterns in mutants affecting protein processing pathways. Gene expression patterns of top DEG known to regulate ER function as defined by KEGG pathway IDs (protein processing in ER—dre04141, proteasome—dre03015) are depicted; genetic variants and treatment cohorts are shown in columns and DEG in rows. |