
Fig. 3
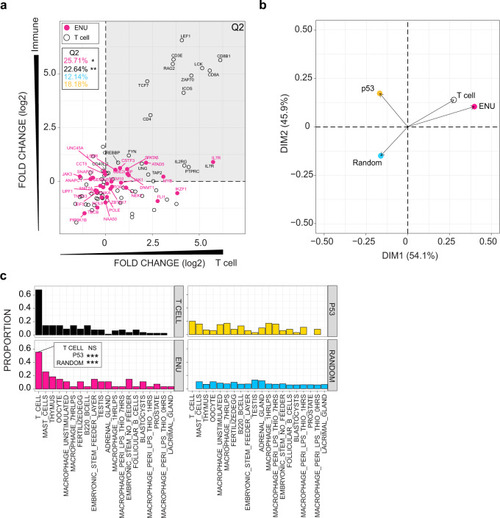
a Expression patterns of mouse homologs of genes identified in the ENU forward genetic screen are compared to genes listed in KEGG pathways designated T cell receptor (mmu04660; T cell), p53 signalling (mmu04115; p53), and a random selection of genes from the mouse genome. BioGPS microarray data were partitioned into four categories (see the “Methods” section); the y-axis depicts expression bias according to immune and non-immune categories, such that genes expressed at higher levels in immune-related cells and tissues have higher values; genes are also partitioned according to T cell and non-T immune cells categories on the x-axis, such that genes expressed at higher levels in T cells as compared to other immune-related cells receive higher values. Relative expression values (log2) for each gene were determined between mean expression values for immune/non-immune and T cell/non-T immune cells partitions. Hence, genes in the upper right quadrant (Q2) represent genes highly expressed by T cells. The percentage of genes in Q2 are depicted; red, genes identified in the forward genetic screen (ENU genes); black, T cell genes; blue, random gene set (genes not depicted in diagram); yellow; p53 signalling genes (genes not depicted in diagram). P values for accumulations was determined by Fisher’s exact test. *P < 0.05; **P < 0.01. b Principal component analysis (PCA) on expression data for the four groups of genes analysed in (a). c Proportion of genes from four groups of genes (T cell-related genes; ENU genes; p53 pathway-related genes; and a random selection of genes from the genome) expressed in various tissue and cells of the mouse. Genes were assigned to a specific origin, if their expression levels were significantly greater than background tissue expression (z score ≥ 1.96). Proportions of genes highly expressed by each tissue were normalized to the numbers of genes. P values for enrichments were determined by Fisher’s exact test. Note that the proportion of ENU genes assigned to T cells in the BioGPS list is indistinguishable from that of T cell genes. By comparison, the proportion of p53-signalling pathway genes and random gene sets are significantly underrepresented (***P < 0.001). |