
- Title
-
Genetic landscape of T cells identifies synthetic lethality for T-ALL
- Authors
- O'Meara, C.P., Guerri, L., Lawir, D.F., Mateos, F., Iconomou, M., Iwanami, N., Soza-Ried, C., Sikora, K., Siamishi, I., Giorgetti, O., Peter, S., Schorpp, M., Boehm, T.
- Source
- Full text @ Commun Biol
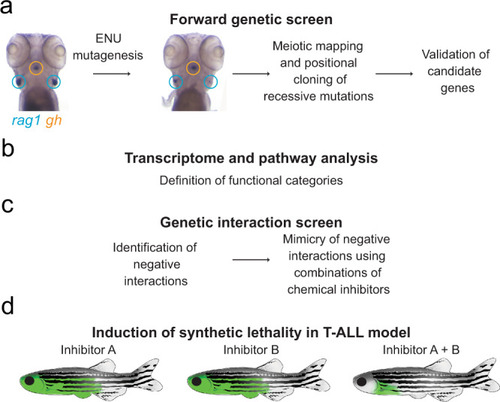
a Identification of genetic variants perturbing T cell development through large-scale forward genetic screens in zebrafish larvae. b Delineation of the genetic network underlying the development of T cells by pairwise interaction analyses. c Phenocopy of a subset of genetic interactions using small molecule inhibitors. d Tumour treatment in an in vivo model of T-ALL based on the information obtained on synthetic lethal interactions. |
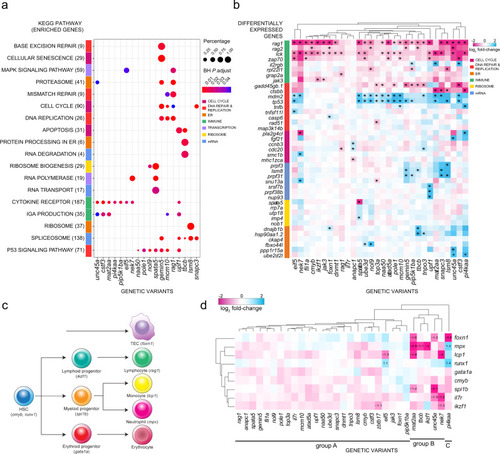
a Transcriptome analysis and ClusterProfiler pathway enrichment of top 1500 differentially expressed genes (DEG) (FDR ≤ 0.05) from each genetic variant. Genetic variants are shown in columns and enriched KEGG pathways in rows, with brackets indicating the number of enriched genes from each pathway; only 18 of 30 genetic variants exhibited significant deregulation of KEGG pathways. Row side colours identify pathways in similar biological functional categories. Point sizes represent the percentages of genes enriched from each pathway for each genetic variant; point colours specify Benjamini–Hochberg (BH)-adjusted P values. b Top DEG in genetic variants. Genetic variants are shown in columns and DEG in rows, grouped by biological functional categories. The following KEGG identifiers were included. T cell development (T cell receptor—mmu04660, primary immunodeficiency—mmu05340, Notch signaling—mmu04330), DNA synthesis (DNA replication—mmu03030, MMR—dre03430, BER—dre03410, HR—dre03440, p53 signaling—dre04115), cell cycle (apoptosis—dre04210, cell cycle—dre04110, cellular senescence—dre04218), mRNA processing (spliceosome—dre03040, mRNA surveillance—dre03015, nonsense-mediated decay—dre03015), ribosome function (ribosome biogenesis—dre03008, ribosome—dre03010) and endoplasmic reticulum (ER) (protein processing in ER—dre04141, proteasome—dre03015). Asterisks define the top six DEG (|log2 fold change| ≥ 0.5) per genetic variant. c Schematic of haematopoietic differentiation pathways. Each cell type is marked with a signature gene(s), whose expression levels are taken as indicative of their presence. Note that the thymic epithelium represents a separate lineage and originates from pharyngeal endoderm. At the time of analysis (5 d.p.f.), B cell development has not yet started, so that rag1 expression levels are indicative of developing T cells. d Expression levels of signature genes (excluding rag1; see Fig. 2b, and text) as determined by RNA-seq at 5 d.p.f. for all genetic variants. The log2 fold changes are indicated. Some of the gene expression changes detected in the RNA-seq analysis were confirmed by RNA in situ hybridization at different stages of development (see Supplementary Fig. 3). |
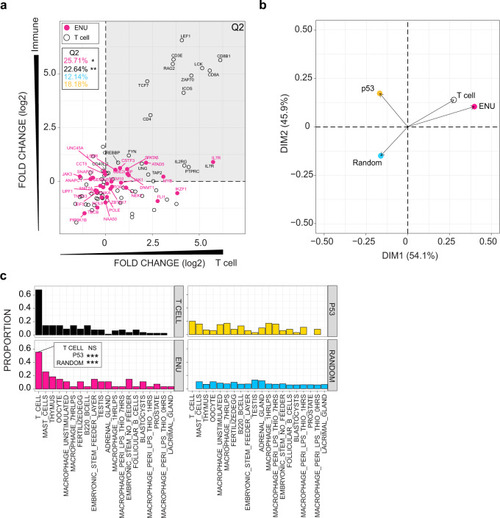
a Expression patterns of mouse homologs of genes identified in the ENU forward genetic screen are compared to genes listed in KEGG pathways designated T cell receptor (mmu04660; T cell), p53 signalling (mmu04115; p53), and a random selection of genes from the mouse genome. BioGPS microarray data were partitioned into four categories (see the “Methods” section); the y-axis depicts expression bias according to immune and non-immune categories, such that genes expressed at higher levels in immune-related cells and tissues have higher values; genes are also partitioned according to T cell and non-T immune cells categories on the x-axis, such that genes expressed at higher levels in T cells as compared to other immune-related cells receive higher values. Relative expression values (log2) for each gene were determined between mean expression values for immune/non-immune and T cell/non-T immune cells partitions. Hence, genes in the upper right quadrant (Q2) represent genes highly expressed by T cells. The percentage of genes in Q2 are depicted; red, genes identified in the forward genetic screen (ENU genes); black, T cell genes; blue, random gene set (genes not depicted in diagram); yellow; p53 signalling genes (genes not depicted in diagram). P values for accumulations was determined by Fisher’s exact test. *P < 0.05; **P < 0.01. b Principal component analysis (PCA) on expression data for the four groups of genes analysed in (a). c Proportion of genes from four groups of genes (T cell-related genes; ENU genes; p53 pathway-related genes; and a random selection of genes from the genome) expressed in various tissue and cells of the mouse. Genes were assigned to a specific origin, if their expression levels were significantly greater than background tissue expression (z score ≥ 1.96). Proportions of genes highly expressed by each tissue were normalized to the numbers of genes. P values for enrichments were determined by Fisher’s exact test. Note that the proportion of ENU genes assigned to T cells in the BioGPS list is indistinguishable from that of T cell genes. By comparison, the proportion of p53-signalling pathway genes and random gene sets are significantly underrepresented (***P < 0.001). |
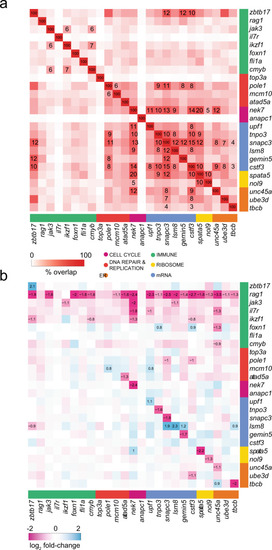
a Overlaps of top 1500 DEG (FDR ≤ 0.05) from each genetic variant grouped by functional categories. Only Jaccard indices with significant overlap (FDR ≤ 0.05), determined using the hypergeometric distribution, are shown; cell notes indicate the percentages of overlap. b Co-regulation of genes identified in the ENU screens. Genetic variants are shown in columns and their expression levels are depicted in rows; genes are grouped by functional categories. Cell notes identify genes with |log2 fold change | ≥ 0.5 and FDR ≤ 0.05. |
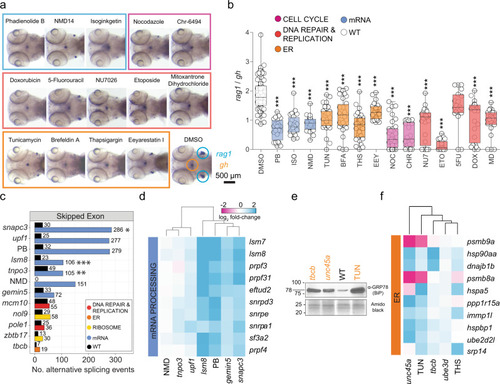
a Representative images at 5 d.p.f. after whole-mount RNA in situ hybridization with rag1- and gh-specific probes for wild-type fish treated with small molecule inhibitors targeting the major pathways impaired by mutant genes. Fish were exposed to drugs between 3 and 5 d.p.f.; DMSO-treated fish were used as negative controls. b rag1/gh ratios of untreated fish (DMSO) and those treated with small molecule inhibitors between 3 and 5 d.p.f. Significance was determined by one-way ANOVA with Dunnett’s post-test. *P < 0.05; **P < 0.01; ***P < 0.001. Abbreviations: 5-fluorouracil (5FU [200 μM]), brefeldin A (BFA [0.75 μM]), Chr-6494 (CHR [0.75 μM]), doxorubicin (DOX [0.75 μM]), eeyarestatin (EEY [800 μM]), etoposide (ETO [1.72 μM]), isoginkgetin (ISO [320 μM]), mitoxantrone dihydrochloride (MD [1.5 μM]), NMD14 (NMD [100 μM]), nocodazole (NOC [0.4 μM]), NU7026 (NU7 [7.5 μM]), pladienolide B (PB [0.2 μM]), thapsigargin (THS [0.5 μM]), and tunicamycin (TUN [1.5 μM]). The concentrations used are indicated in square brackets after the abbrevaitions. See source data file for b in Supplementary Data 2. c Effect of small molecule spliceosome inhibitor (PB) and an inhibitor of non-sense mediated decay (NMD14), on pre-mRNA processing, compared to defects in mutants. Numbers of significant skipped exon events are depicted atop each bar, as determined by reads covering exon boundaries; FDR ≤ 0.05, |inclusion level difference | ≥ 0.250) relative to wild-type siblings. *P < 0.05; **P < 0.01; ***P < 0.001. d PB and NMD14 mimic the effects of mutants acting in pre-mRNA processing pathways. Gene expression patterns of top DEG known to regulate mRNA processing as defined by KEGG pathway IDs (spliceosome—dre03040, mRNA surveillance—dre03015, nonsense-mediated decay—dre03015) are depicted; genetic variants and treatment cohorts are shown in columns and DEG in rows. e The small molecule ER inhibitor, TUN, mimics the proteomic and transcriptional ER stress response observed in mutants. A Western blot of protein lysates of 5 d.p.f. zebrafish mutants/treatment cohorts were resolved with antibodies detecting the ER stress-related component GRP78 (BiP). Amido black staining of total protein was used as a loading control. Tunicamycin (TUN)-treated wild-type fish were included as positive control of ER stress activation. Sizes of markers are indicated in kDa. f Small molecule ER inhibitors, TUN and THS, mimic differential gene expression patterns in mutants affecting protein processing pathways. Gene expression patterns of top DEG known to regulate ER function as defined by KEGG pathway IDs (protein processing in ER—dre04141, proteasome—dre03015) are depicted; genetic variants and treatment cohorts are shown in columns and DEG in rows. |

a Schematic of the types of experiments underlying the interaction network. The integrated interaction screen consists of mutant–mutant, mutant–morpholino, morpholino–morpholino, mutant–inhibitor, and inhibitor–inhibitor interactions, where the numbers of T cells as determined by rag1 gene expression relative to growth hormone (gh)-expressing somatotrophic epithelial cells is normalized to wild-type levels (WWT; fitness). Single mutant (Wx, Wy) and double mutant fitness (Wxy) values were determined by normalization of their rag1/gh ratios to wild-type rag1/gh ratios. The expected double mutant fitness E(Wxy) is the product of single mutant fitness values (Wx × Wy). A non-interactive line is assigned to an observed double-mutant fitness value that is within the propagated error of expected double-mutant fitness. Negative interaction is called when an observed double-mutant fitness is significantly less than the expected double-mutant fitness minus the propagated error. Positive–coequal interaction is called when an observed double-mutant fitness is significantly greater than the expected double-mutant fitness plus the propagated error, but equivalent to the least fit single mutant. Positive–suppressive interaction is called when an observed double-mutant fitness is significantly greater than the expected double-mutant fitness plus propagated error and greater than the least fit single mutant. b Effect of gene mutations (mutants and morphants) and inhibitor treatments on two different tissues, pituitary gland (as determined by gh expression) and T cell (as determined by rag1 expression). The changes in expression levels in percent relative to genetically wild-type (panel designated gene) or untreated controls (panel designated inhibitor) are given for rag1 and gh hybridization signals (cf., Figs. 4 and 5). For both types of analyses, the differences between gh and rag1 expression levels are significant at P < 0.001 (two-tailed Student´s t-test). c Effect of gene–gene genetic interactions (mutant–mutant) and inhibitor genetic interactions (inhibitor–inhibitor) on two different tissues, T cell (rag1) and pituitary gland (gh). Relative log2-fold changes between observed (Wxy) and expected double mutant fitness E(Wxy) values are given for T cells and growth hormone-producing somatotropic cells. Colours represent the interaction types (black, non-interactive; magenta, negative; light-blue, positive-coequal; dark blue, positive-suppressive). P values were determined by two-tailed Student´s t-test. Statistical tests for homogeneity of variances were performed using Bartlett’s test. |
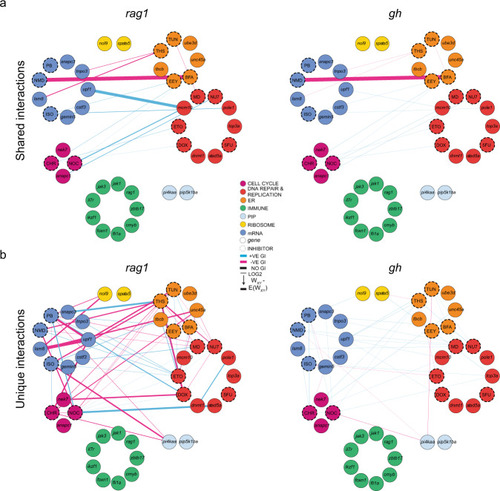
a Shared genetic interactions between mutant genes and inhibitors affecting fitness of both T cells (rag1) and growth hormone-producing somatotropic cells (gh). Line font size reflects relative log2-fold changes between observed and expected double mutant fitness values. Nodes are grouped by primary biological pathways that are affected by mutations or inhibitors. Solid or dashed circles around each node denote either genes or inhibitors, respectively. For this presentation, positive–suppressive and positive–coequal interactions are combined. Colours represent interaction types (magenta, negative; blue, positive; black, non-interactive). 5FU 5-fluorouracil), BFA brefeldin A, CHR Chr-6494, DOX doxorubicin, EEY eeyarestatin, ETO etoposide, ISO isoginkgetin, MD mitoxantrone dihydrochloride, NMD NMD14, NOC nocodazole, NU7 NU7026, PB pladienolide B, THS thapsigargin, and TUN tunicamycin. b, Cell type-specific genetic interactions between mutant genes and inhibitors specifically affecting fitness of T cells. |
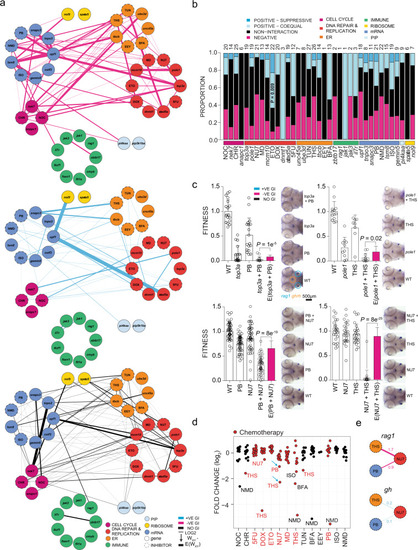
a Genetic interactions between genes and inhibitors affecting fitness of T cells (rag1) normalized to fitness of growth hormone-producing somatotropic cells (gh). Line font size reflects relative log2 fold-changes between observed and expected double-mutant fitness values for rag1/gh ratios. Nodes are grouped by primary biological pathways affected by mutation or inhibitor. Solid or dashed circles around each node denote either genes or inhibitors, respectively. For this presentation, positive–suppressive and positive–coequal interactions are combined. Colours represent interaction types (magenta, negative; blue, positive; black, non-interactive). b Proportions of interaction types by genes and inhibitors, grouped by biological functional categories. The number of interactions per node, including non-interaction, is depicted atop each bar. P values for genetic interaction type composition deviating from the average of all interactions were determined by Fisher’s exact test. c rag1/gh ratios (fitness) normalized to wild-type for genetic variants and inhibitor treatments. The observed double mutant fitness values are compared to the expected double mutant fitness values (E); negative genetic interactions between ER–mRNA processing and ER–DNA are independent of experiment types (mutant–inhibitor or inhibitor–inhibitor). P values were determined by two-tailed Student’s t-test. d Genetic interaction between inhibitors affecting fitness of T cells. Relative log2-fold changes between observed and expected double mutant fitness values for rag1/gh ratios. Inhibitor combinations denoted with blue arrow were tested in adolescent fish and in the tumour model. e Discordant cell type-specific genetic interactions between inhibitors affecting fitness of T cells (rag1) and growth hormone-producing somatotropic cells (gh). The identification of cell type-specific strongly negative interactions informs choices for in vivo treatment of T-ALL. 5FU 5-fluorouracil, BFA brefeldin A, CHR Chr-6494, DOX doxorubicin, EEY eeyarestatin, ETO etoposide, ISO isoginkgetin, MD mitoxantrone dihydrochloride, NMD NMD14, NOC nocodazole, NU7 NU7026, PB pladienolide B, THS thapsigargin, and TUN tunicamycin. |
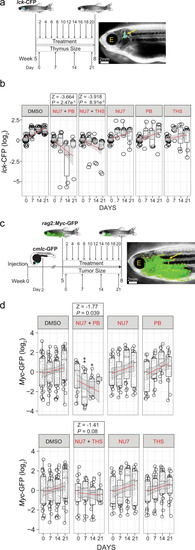
a Treatment schedule of adolescent lck-CFP zebrafish (5 weeks of age) with the indicated inhibitor combinations. The thymus size relative to fish size was measured weekly. Representative dark field image of a zebrafish with the lck-CFP fluorescent signal overlay (yellow arrow and outline). The position of the eye is labelled for orientation (E). b Thymus size during combination treatment of adolescent lck-CFP zebrafish. The sizes of thymi are expressed as log2-fold changes relative to the sizes at day 0 of treatment. The significance of differences between day 0 and days following treatment was determined by two-way ANOVA, for repeated measurements with Bonferroni post-test. A z statistic was used to compare regression coefficients between treated and untreated groups. See source data file for Fig. 9b in Supplementary Data 2. c Treatment schedule of adolescent rag2:Myc-GFP–injected zebrafish (5 weeks of age) with inhibitor combinations, following the onset of T-ALL. Rag2:Myc-GFP and cmlc-GFP containing plasmids were co-injected into wild-type fish at the one-cell stage and sorted for heart expression of the cmlc-GFP reporter at 2 d.p.f. as an indicator of successful transgenesis. Transgenic fish were grown until the age of 5 weeks and then sorted for onset of T-ALL using rag2:Myc-GFP. Tumor sizes relative to fish size were measured weekly. Representative dark field image of a 5 week old zebrafish with rag2:Myc-GFP fluorescent signal overlay (yellow arrow and outline). d T-ALL tumor sizes following combination inhibitor treatment of adolescent rag2:Myc-GFP. Tumor sizes are expressed as log2-fold changes relative to day 0 of treatment. *P < 0.05; **P < 0.01. See source data file for Fig. 9d in Supplementary Data 2. |