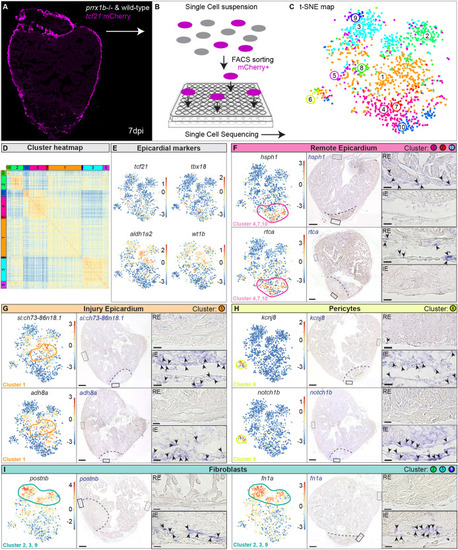
Single-cell sequencing identifies epicardial-derived cell populations in the injured zebrafish heart. (A,B) Workflow of the isolation (A) and sorting (B) of tcf21:mCherry+ cells in wild-type and prrx1b−/− hearts at 7 dpi. (C,D) tSNE plotting of the data results in ten transcriptionally distinct clusters (C), as also indicated by the heatmap (D). (E) tSNE maps visualizing log2-transformed read-counts for tcf21, tbx18, aldh1a2 and wt1b. (F-I) Characterization of the different cell clusters. Left: Panels show tSNE maps visualizing log2-transformed read-counts for genes with high expression in the indicated cluster (circled). Middle: In situ hybridization for the cluster-enriched genes in wild-type hearts at 7 dpi. Dashed line indicates injury border. Scale bars: 100 μm. Right: Magnifications of the boxed regions in remote (RE) and injury epicardium (IE) with arrowheads pointing to cells with high expression. Scale bars:10 μm. Three hearts analysed per condition. Gene lists are provided in Table S1.
|
