FIGURE

Figure 4

ID
ZDB-FIG-211025-51
Publication
Paolini et al., 2021 - Mechanosensitive Notch-Dll4 and Klf2-Wnt9 signaling pathways intersect in guiding valvulogenesis in zebrafish
Other Figures
All Figure Page
Back to All Figure Page
Figure 4

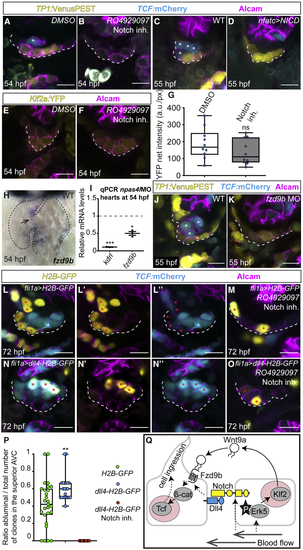
Notch-Dll4 signaling singles out cells that are competent to respond to Wnt9a

(A–D) Single confocal z section plane images of the superior atrioventricular endocardium at 54 hpf (A and B) and 55 hpf (C and D). (B) Treating embryos with the Notch inhibitor RO4929097 prevents TCF expression and ingression of single endocardial cells (asterisk in A). (C and D) Unlike in wild type (C), overexpression of the Notch intracellular domain within endocardium (nfatc > NICD) prevents TCF expression and ingression of endocardial cells (D) (see asterisks in C).

(E–G) Quantification of klf2a:YFP net fluorescence intensity in the superior AVC endocardium of DMSO- versus RO4929097-treated embryos at 54 hpf (DMSO-treated, n = 10 embryos; RO4929097-treated, n = 10 embryos). Single values are shown in a boxplot. Lines inside the box represent mean values. Lower and upper whiskers indicate minimum and maximum values, respectively (ns = not significant by unpaired Student’s t test).

(H) Whole-mount in situ hybridization of fzd9b cardiac expression at 54 hpf. fzd9b expression in the superior AVC endocardium is highlighted by a black arrow.

(I) Quantitative real-time PCR quantifications of kdrl and fzd9b mRNAs in npas4l morphants when normalized to wild-type hearts. Minimum to maximum values are shown (n = 3 experiments; p < 0.05 and ∗∗∗p < 0.001 by ratio paired Student’s t test).

(J and K) Single confocal z section plane images of the superior AVC endocardium at 55 hpf. (J) The ingression of endocardial cells is marked with asterisks. (K) Endocardial TCF reporter expression is lost upon MO-mediated knockdown of fzd9b, and ingression of endocardial cells is prevented.

(L–O) Single confocal z section plane images of the superior AVC endocardium at 72 hpf. Shown are representative cell clones in Tg(fli1a:GAL4FF)ubs3 embryos injected with either UAS:H2B-GFP (L) and treated with RO4929097 (M) or injected with UAS:dll4-H2B-GFP DNA constructs (N) and treated with RO4929097 at 72 hpf (O). Cell clones overexpressing DNA constructs are marked with red asterisks.

(P) Quantifications of ratio of clones that ingressed into the abluminal side with respect to the total number of clones integrated in the superior AVC endocardium (UAS:H2B-GFP-injected, n = 27 embryos; UAS:dll4-H2B-GFP-injected, n = 22 embryos; UAS:dll4-H2B-GFP-injected and RO4929097-treated, n = 16 embryos). Single values are shown in a boxplot. Lines inside the box represent mean values. Lower and upper whiskers indicate minimum and maximum values, respectively. (∗∗p < 0.01 by unpaired Student’s t test).

(Q) Model of blood-flow-dependent molecular mechanisms that result in singling out of atrioventricular endocardial cells at the beginning of valve morphogenesis. Scale bars, 5 μm

Expression Data
Genes:
Antibody:
Fish:
Condition:
Knockdown Reagents:
Anatomical Terms:
Stage: Long-pec

Expression Detail
Antibody Labeling
Phenotype Data
Fish:
Condition:
Knockdown Reagents:
Observed In:
Stage: Long-pec

Phenotype Detail
Acknowledgments
This image is the copyrighted work of the attributed author or publisher, and ZFIN has permission only to display this image to its users. Additional permissions should be obtained from the applicable author or publisher of the image. Full text @ Cell Rep.