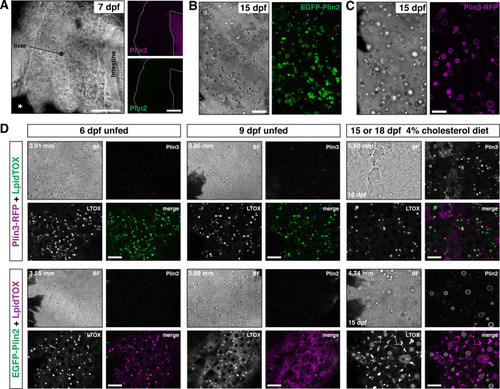
(A) Lateral view of the liver in a 7 days post fertilization (dpf) zebrafish larvae heterozygous for both Fus(plin3-RFP) and Fus(EGFP-plin2). Scale = 50 µm. (B, C) Brightfield and fluorescence liver micrographs from 15 dpf larval zebrafish fed a diet of Gemma +4% cholesterol for 10 days. Lipid droplets in hepatocytes can be labeled with EGFP-Plin2 (B) and with Plin3-RFP (C). Scale = 20 µm. (D) Liver micrographs from 6, 9, 15 (Fus(EGFP-plin2)) or 18 dpf (Fus(plin3-RFP)) zebrafish. LipidTox Green or Red (LTOX) labels the hepatic ducts and the lipid droplets, which are also visible in the brightfield image (BF). Where noted, fish were fed a Gemma +4% cholesterol diet starting at 5 dpf. Standard length of the imaged fish is noted on the upper left corner of each set of image, see source data for additional standard length data. Scale = 20 µm. Images are representative of at least 15 fish from three or more clutches.