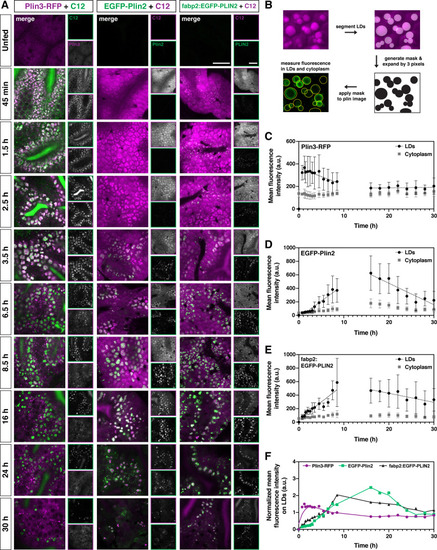
(A) Representative confocal micrographs of Fus(plin3-RFP)/+, Fus(EGFP-plin2)/+, or Tg(fabp2:EGFP-PLIN2)/+ fish fed a high-fat meal containing either green or red BODIPY C12 fatty acid analog. Fish were fed for a total of 90 min and chased at room temperature for 30 hr after the onset of the meal. Scale = 20 µm. See also Figure 4—video 1, Figure 4—video 2, Figure 4—video 3. (B) Perilipin fluorescence associated with the lipid droplets and in the cytoplasm was assessed by first segmenting the lipid droplets based on the BODIPY C12 signal, the segmented regions were expanded by three pixels in all dimensions (360 nm) to create a mask which was then applied to corresponding Plin fluorescent image. Mean fluorescence intensity was assessed both in the masked regions (LDs) and outside (cytoplasm). (C–E) Mean fluorescence intensity of Plin3-RFP (C), EGFP-Plin2 (D), and over-expressed human EGFP-PLIN2 (E) in the cytoplasm and associated with lipid droplets over time following a high-fat meal (mean ± SD). Data represent two experiments per genotype, each experiment contained larvae from two clutches (n = 9–12 (C), 4–18 (D), and 3–15 (E) fish per time-point). Due to the complexity and length of the time-course, the 0–8.5 and 16–30 hr time-points represent data from different clutches. The linear correlation coefficients (R) for the 0.75–8.5 hr time-points are –0.3266 (y = –15.20x + 364), 0.7732 (y = 48.91x + (–34.40)), and 0.7277 (y = 52.33x + 36.64) for Plin3, Plin2, and PLIN2, respectively. For the 16–30 hr time-points, the R coefficients are 0.0349 (y = 0.3730x + 180.6), –0.6321 (y = –31.84x + 1113), and –0.2865 (y = –13.33x + 693.8) for Plin3, Plin2, and PLIN2, respectively. (F) Data from C, D, and E were normalized based on the overall mean fluorescence from all individual data points for each genotype and plots were overlaid to better show the relationship between genotypes. A LOWESS local regression line was applied to the normalized data-sets for visualization purposes only.