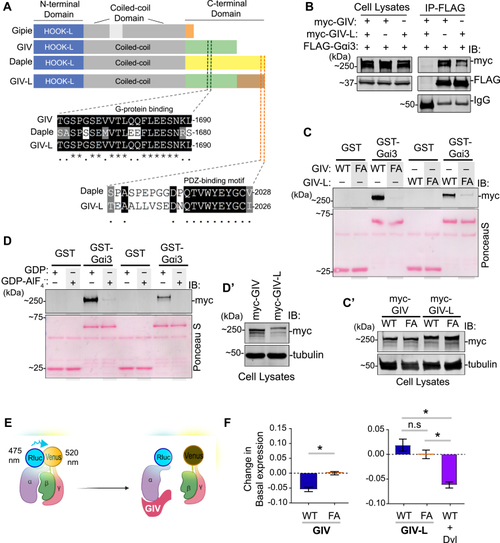
Both GIV and GIV-L use their GEM motifs to preferentially bind GDP-bound Gαi, but only GIV WT nor other GIV variants, to reduce basal Gαi-RLuc2/mVenus-Gbg BRET in HEK293T cells.A, a schematic displaying the modular makeup of the CCDC88 family of proteins, from top to bottom—CCDC88A/GIV, CCDC88B/Gipie, and CCDC88C/Daple. B, equal aliquots of lysates of HEK293T cells coexpressing FLAG-tagged Gαi3 and either myc-tagged GIV or GIV-L constructs were subjected to immunoprecipitation assays using an anti-FLAG antibody. Bound proteins and cell lysates were assessed for Gαi3 (FLAG) and GIV (myc) by immunoblotting (IB). C, GST-pull-down assays were carried out using purified GST-Gαi3 and lysates of HEK293T cells exogenous expressing myc-tagged wild-type (WT) or F1685A mutant (FA) of human GIV or GIV-L. Bound GIV was analyzed by immunoblotting (IB) using an anti-myc antibody. Panel C′ shows expression of proteins in the HEK293T cell lysates that were used as source of GIV in pull-down assays. D, GST-pull-down assays were carried out using purified GST-Gαi3, preloaded with GDP or GDP-AlF4−, and lysates of HEK293T cells exogenously expressing myc-tagged wild-type human GIV or GIV-L. Panel D’′shows expression of proteins in the HEK293T cell lysates that were used as source of GIV in pull-down assays. E, a schematic representation of the Gαi1(91)-RLuc2/mVenus-Gβγ BRET experiment. In the Gαiβγ heterotrimer, the proximity of RLuc2 (fused to Gαi1) to mVenus (fused to Gβγ) generates higher energy transfer (BRET); reduced BRET indicates the dissociation of Gαi1(91)-RLuc2 from mVenus-Gβγ. F, change in basal Gαi1(91)-RLuc2/mVenus-Gβγ BRET in HEK293T cells transfected with the indicated GIV-WT or GEM-deficient F1685A (‘FA’) mutants in the same experiment. The average BRET was calculated over 3 min after adding the Rluc2 substrate, Coelenterazine-h, and the corresponding value from GIV-FA (inactive) cells was subtracted. The experiment was performed in three independent biological replicates on different days, each containing three technical replicates. Error bars represent SEM (n = 3 biological replicates). The graphs were plotted using GraphPad Prism 5 and statistical significance was calculated using Mann–Whitney paired t-test.
|
