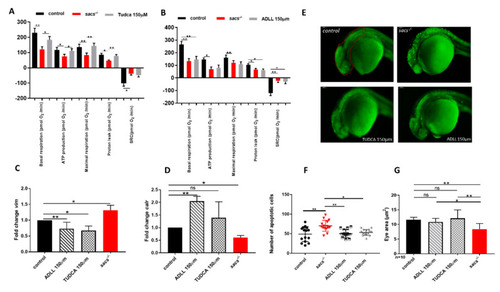
ADLL and TUDCA restore gene expression profile and prevent apoptosis in sacs−/− larvae. (A,B) Mitochondrial respiratory analysis after drug treatments. For each experiment, we compared treated sacs−/− larvae (n = 18) and untreated sacs−/− larvae (n = 18) and control (n = 18) at 120 hpf. * p ≤ 0.05, ** p ≤ 0.01, calculated by the non-parametric Kruskal-Wallis test. (C,D) qRT-PCR analysis on sacs−/− larvae after drug treatments. Three independent RNA samples from each group (controls, untreated sacs−/− and treated sacs−/−) were evaluated. * p ≤ 0.05, ** p ≤ 0.01, calculated by Dunnett’s multiple comparisons test. Abbreviation: ns, not significant (E) Detection of dying cells by acridine orange staining of 24 hpf sacs−/− embryos after drug treatments. The total number of embryos used per group tested (controls, untreated sacs−/− and treated sacs−/−) was 15. (F) Apoptotic cells were counted in the area defined by the red circle. Quantitative analysis of apoptotic cells. * p ≤ 0.05; ** p ≤ 0.01, calculated by the non-parametric Kruskal-Wallis test. The values are expressed as mean ± standard deviation. (G) Evaluation of the eye area of sacs−/− after drug treatments (controls, untreated sacs−/− and treated sacs−/−). * p ≤ 0.05, ** p ≤ 0.01, calculated by the non-parametric Kruskal-Wallis test. The values are expressed as mean ± standard deviation. Abbreviations: n, total number of evaluated embryos; error bars indicate standard errors of the means; ns, not significant.
|
