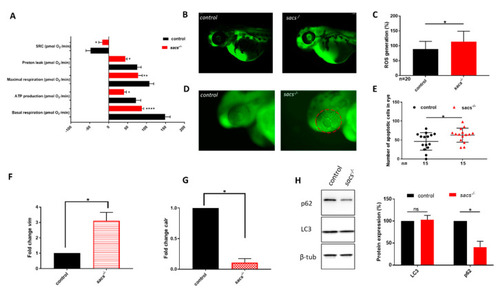
Sacs−/− mutant zebrafish manifest mitochondrial and autophagic dysfunction and ROS accumulation. (A) Mitochondrial respiratory analysis of controls (n = 30) and sacs−/− mutant larvae (n = 37) at 120 hpf. * p ≤ 0.05, ** p ≤ 0.01, **** p ≤ 0.0001, calculated by the Mann-Whitney test. (B) Representative fluorescence images of ROS generation in zebrafish larvae at 48 hpf. (C) Quantitative analysis of ROS generation. * p ≤ 0.05 was calculated by the Mann-Whitney test. The values are expressed as mean ± standard deviation (SD). (D) Detection of apoptotic cells by acridine orange staining at the level of the eye in controls and sacs−/− mutant embryos at 48 hpf (lateral views). Apoptotic cells were counted in the area defined by the red circle. (E) Quantitative analysis of apoptotic cells. * p ≤ 0.05 was calculated by the Mann-Whitney test. The values are expressed as mean ± standard deviation (SD). (F,G) qRT-PCR analysis revealed increases in vim and calr expression, once the mRNA expression levels had been normalized to β-actin. Three independent RNA samples from controls and sacs−/− mutant larvae at 120 hpf were analyzed. * p ≤ 0.05, calculated by Student’s t-test. (H) Three independent larval homogenates from controls (n = 50) and sacs−/− larvae (n = 50) were tested by Western blotting for the expression of p62 and LC3 proteins. The levels of the different proteins were normalized to β-tubulin. * p ≤ 0.05 was calculated by Student’s t-test. Abbreviations: n, number of evaluated embryos in total; error bars indicate standard error of the mean; ns, not significant; SRC, spare respiratory capacity; ROS, reactive oxygen species.
|
