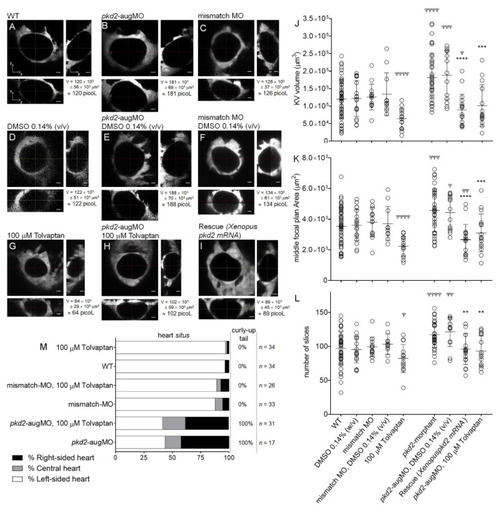
KV volume, a live readout of the CFTR activity. (A–I) Confocal live-microscopy scans of whole KVs from sox17:GFP transgenic embryos, at 10–11 ss. The middle focal plane along the xy axis and its respective orthogonal views (along xz and yz axes) are shown for the most representative embryos: WT (A), pkd2-knockdown (B), mismatch MO (C), WT + 0.14% (v/v) DMSO (D), pkd2-knockdown + 0.14% (v/v) DMSO (E), mismatch MO + 0.14% (v/v) DMSO (F), WT + 100 μM tolvaptan (G), pkd2-knockdown + 100 μM tolvaptan (H), and rescue (pkd2-knockdown + Xenopus pkd2-mRNA) (I). KV volume is indicated in μm3 and in picoliters. Scale bars: 10 μm. (J,K,L) Estimated KV volumes (μm3), middle focal plan area (μm2) and number of slices of the z-stacks for WT (n = 51), WT treated with 0.14% (v/v) DMSO (n = 19), mismatch-MO (n = 14), mismatch MO + 0.14% (v/v) DMSO (n = 11), 100 μM tolvaptan (n = 14), pkd2-knockdown (n = 38), pkd2-knockdown treated with 0.14% (v/v) DMSO (n = 13), 100 μM tolvaptan (n = 16), and rescue (pkd2-knockdown + Xenopus pkd2-mRNA) (n = 18). Mean ± S.D. All samples, except mismatch MO + 0.14% (v/v) DMSO volume and middle focal plan area, pkd2-knockdown + 100 μM tolvaptan volume, pkd2-knockdown number of slices, and pkd2-knockdown + 0.14% (v/v) DMSO number of slices, had a normal distribution. The comparisons of samples that did not have normal distribution with respective WT and pkd2-knockdown samples were analyzed with the Mann–Whitney test. t-test with the Welch correction was used to compare WT + 100 μM tolvaptan with WT volume and middle focal plan area (samples with unequal variances). All other comparisons to WT and to pkd2-knockdown samples were made using the t-test. ψ p < 0.05, ψψ p < 0.01, ψψψ p < 0.001, and ψψψψ p < 0.0001, significantly different from WT; and **** p < 0.0001, *** p < 0.001, and ** p < 0.01, significantly different from pkd2-knockdown embryos. (M) Heart position defects and curly-up tail phenotype of WT and mismatch-MO controls and PC2 knockdown embryos, treated with 100 μM tolvaptan. n, number of scored embryos.
|
