|
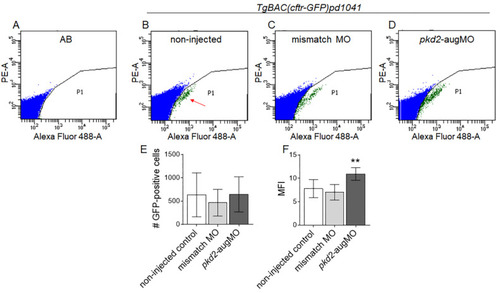
Flow cytometry analysis of the CFTR-GFP protein level in TgBAC(cftr-GFP)pd1041 embryos. Flow cytometry plots representative of AB control (A) and non-injected TgBAC(cftr-GFP)pd1041 8–10 ss (B) embryos, for the established limiting gates. Red arrow indicates the GFP-positive cell population. (C,D) Flow cytometry plots representative of the GFP-positive cells of mismatch-MO (C) and pkd2-augMO (D) embryos. (E) Number of analyzed GFP-positive cells of non-injected controls (11 replicates), mismatch-MO (3 replicates), and pkd2-knockdown embryos (5 replicates). Each replicate had about 200 embryos. (F) MFI determined for GFP-positive cells of non-injected controls, mismatch-MO, and pkd2-knockdown embryos. Median averages ± SD are indicated. As the pkd2-augMO injected embryos sample did not follow a normal distribution, the Mann–Whitney test was used to compare pkd2-augMO versus non-injected embryos MFIs, ** p < 0.01.
|