FIGURE

Fig. 3

ID
ZDB-FIG-210817-13
Publication
Sehgal et al., 2021 - LncRNA VEAL2 regulates PRKCB2 to modulate endothelial permeability in diabetic retinopathy
Other Figures
All Figure Page
Back to All Figure Page
Fig. 3

<italic toggle='yes'>veal2</italic> lncRNA interacts and negatively regulates Prkcbb protein in zebrafish

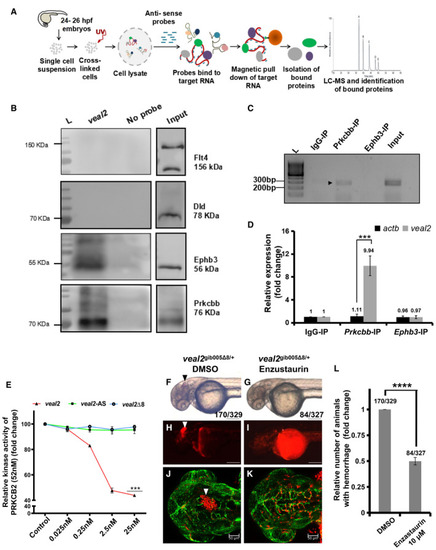
Schematic of the methodology adopted for the identification of protein interacting partners of veal2 using a RAP‐MS‐based approach.

RAP‐MS followed by Western blotting validated Prkcbb and Ephb3 as interacting protein partners with veal2.

RNA immunoprecipitation of veal2 was performed by pulldown of Prkcbb and Ephb3, followed by qRT–PCR. IgG pulldown was performed as control. Gel image shows the amplification of veal2 in different RNA immunoprecipitation samples, along with 10% input control, as marked by arrowheads.

qRT–PCR‐based quantification of veal2 transcript across Prkcbb, Ephb3, and IgG immunoprecipitations. actb was used as normalization control. Data from three different biological replicates represented as mean fold change values ± standard deviation.

Relative kinase activity of human PRKCB2 under standard conditions and in the presence of various concentrations of the WT veal2 RNA, veal2‐Δ8 RNA, and veal2‐AS RNA. 52 nM of the PRKCB2 protein was used per reaction. Data from three different experiments plotted as mean fold change values ± standard deviation.

Enzastaurin treatment rescues hemorrhage phenotype in veal2gib005Δ8/+ zebrafish embryos indicated by rescue of the vascular integrity defects in veal2gib005Δ8/+. Arrowheads show the presence of hemorrhage due to the vascular integrity defects. Experiment was repeated in biological replicates, and a total no. of embryos scored are mentioned in figure. (F–I) Magnification‐5× and scale bar‐100 μm. (J–K) Magnification‐20× and scale bars‐50μm.

Relative number of animals that displayed the hemorrhage phenotype across the progeny of the outcross of veal2gib005Δ8/+ zebrafish. Number of phenotypic animals upon treatment with Enzastaurin was normalized with the number of phenotypic animals when treated with DMSO. Data from three different experiments plotted as mean fold change values ± standard deviation.

Data information: All the experiments N ≥ 3. ***P‐value < 1E‐3 and ****P‐value < 1E‐4. Statistics: (D,L) unpaired two‐tailed t‐tests. (E) Two‐way ANOVA with Bonferroni’s multiple data comparison.

Source data are available online for this figure.

Expression Data

Expression Detail
Antibody Labeling
Phenotype Data

Phenotype Detail
Acknowledgments
This image is the copyrighted work of the attributed author or publisher, and ZFIN has permission only to display this image to its users. Additional permissions should be obtained from the applicable author or publisher of the image. Full text @ EMBO J.