FIGURE

Fig. 5

ID
ZDB-FIG-210817-15
Publication
Sehgal et al., 2021 - LncRNA VEAL2 regulates PRKCB2 to modulate endothelial permeability in diabetic retinopathy
Other Figures
All Figure Page
Back to All Figure Page
Fig. 5

A conserved human <italic toggle='yes'>VEAL2</italic> (<italic toggle='yes'>VEAL2</italic>) interacts and regulates human protein kinase c beta protein

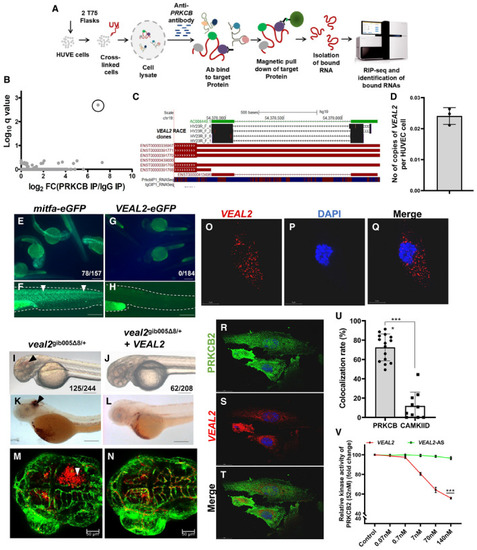
Schematic of the methodology adopted for the identification of RNA interacting partners of PRKCB in HUVECs using a RIP‐seq‐based approach.

RIP‐seq of PRKCB in HUVECs identified a candidate lncRNA with significant q‐value (0.002) and high expression.

Representation of genomic location of AC008440.2‐human vascular endothelial‐associated lncRNA 2 (VEAL2) transcript. It is anti‐sense to 3’ UTR of known protein‐coding myeloid‐associated differentiation marker(MYADM) gene. 3’RACE analysis confirmed VEAL2 as an independent transcript. Reads from PRKCB‐RIP‐seq and IgG‐RIP‐seq mapping to VEAL2 loci are also given. Blue highlights reads mapping to +ve strand, and red highlights reads mapping to ‐ve strand.

Absolute quantification of VEAL2 in HUVECs revealed 0.024 copies per cell. 102 to 108 copies of VEAL2 RNA were used to make the standard curve. Data from three different experiments plotted as mean values ± standard deviation.

e‐GFP fusion assay confirms lack of peptide formation from veal2 sequence. (E–F) mitfa‐eGFP fused transcript. (G–H) VEAL2eGFP fused transcript. Arrowheads indicating e‐GFP expression in mitfa‐eGFP‐injected embryos. Scale bar‐100 μm.

Complementation of VEAL2 in veal2gib005Δ8/+ embryos significantly rescued hemorrhage phenotype. Arrowheads show the presence of hemorrhage due to the vascular integrity defects. (I–L) Magnification‐5× and scale bar‐100 μm. (M–N) Magnification‐20× and scale bars‐50 μm.

Single molecule FISH (smFISH) of VEAL2 in HUVECs shows its cytoplasmic localization. (O) VEAL2 in CAL Fluor Red (610 nM). (P) DAPI. (Q) Merged image for VEAL2 and DAPI. Magnification‐100× and scale bar‐5 μm.

Co‐IF for PRKCB and smFISH of VEAL2 highlight their colocalization. (R) PRKCB in the GFP channel. (S) VEAL2 in CAL Fluor Red (610 nM). (T) Merged image for PRKCB and VEAL2. Magnification‐100× and scale bar‐20 μm.

Bar graph represents the colocalization rate (%) of VEAL2 with PRKCB and CAMKIID proteins in HUVECs. Data from three different experiments plotted as individual values with mean percentage values ± standard deviation.

Relative kinase activity of human PRKCB2 under standard conditions and in the presence of various concentrations of the WT VEAL2 RNA and VEAL2‐AS RNA. 52 nM of the PRKCB2 protein was used per reaction. Data from three different experiments plotted as mean fold change values ± standard deviation.

Data information: All the experiments N ≥ 3. ***P‐value < 1E‐3. Statistics: (U) unpaired two‐tailed t‐test. (V) Two‐way ANOVA with Bonferroni’s multiple data comparison.

Source data are available online for this figure.

Expression Data

Expression Detail
Antibody Labeling
Phenotype Data

Phenotype Detail
Acknowledgments
This image is the copyrighted work of the attributed author or publisher, and ZFIN has permission only to display this image to its users. Additional permissions should be obtained from the applicable author or publisher of the image. Full text @ EMBO J.