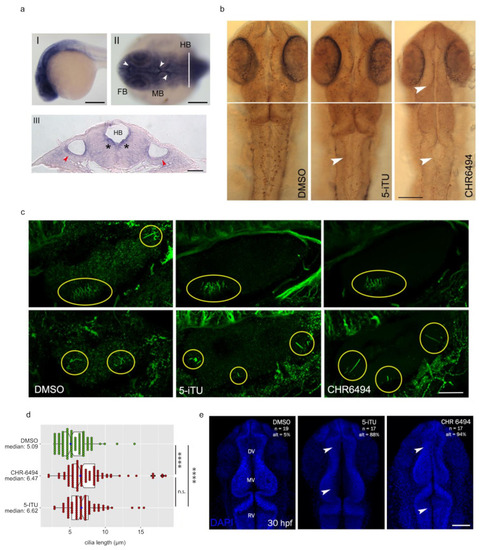
Haspin regulates cilia in the zebrafish embryo. (a-I) expression pattern of zebrafish Haspin at 24 hpf. Lateral view, anterior to the left. The gene is expressed in all brain vesicles; (a-II) dorsal view of the cephalic region, anterior to the left. The neuromeres are all heavily labeled, with a further intense signal pinpointing the whole periventricular portion of the developing brain (white arrowheads); (a-III) histological section conducted according to the plane shown in a-II (white line). The signal is clearly visible in the cells surrounding the ventricles (black asterisks) and the cells of the otic vesicle (red arrowheads). FB, forebrain; MB, midbrain; HB, hindbrain; (b) embryos were treated with either DMSO, 5-ITU, or CHR-6494 until 48 hpf, when they were processed for immunohistochemistry with a phosphorylated H3-T3 antibody. Dorsal views are shown; white arrowheads indicate points of reduced histone phosphorylation; (c,d) embryos were incubated with DMSO or Haspin inhibitors for 72 h when they were fixed and processed for immunofluorescence against acetylated tubulin. Yellow circles indicate ciliated regions, two different z stacks for each sample are shown; cilia length was measured and is reported in d; boxes include 50% of the data points, notch represent confidence interval (median ± 1.58 IQR/sqrt(n)). t-test was applied as a statistical measurement, n.s.; not significant, * p < 0.05, **** p < 0.001; (e) embryos were treated with DMSO or Haspin inhibitors for 30 h and then stained with DAPI to monitor neural tube morphology. Scale bars: (a-I) 200 µm; (a-II) 50 µm; (a-III) 10 µm; (b) 100 µm; (c) 25 µm; (e) 100 µm.
|
