|
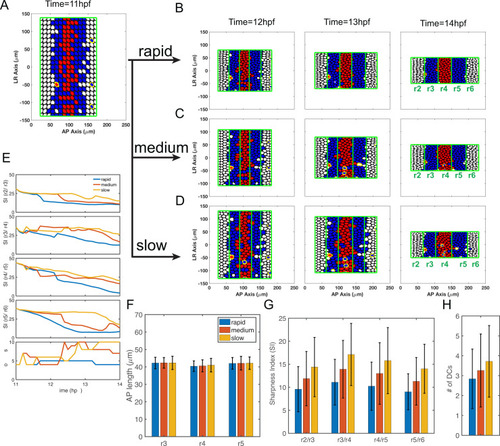
Simulations with selective cell-cell adhesion/sorting alone with different convergence rates.(A-D) Time series of cell distributions with different convergence rates from 11 to 14 hpf. hoxb1a (red) and krox20 (blue) expression. Dislocated cells (DCs) are highlighted by yellow edges. (A) Three simulations start with the same initial cell distribution (11 hpf) generated by the Gaussian mixture distribution. Cell distributions with (B) rapid, (C) medium and (D) slow initial convergence from 12–14 hpf. (E) The boundary sharpness index (SI) for four boundaries (SI(r2/r3), SI(r3/r4), SI(r4/r5) and SI(r5/r6)) and number of DCs versus time. (F-H) Histograms depicted three convergence rates analyzed for their (F) rhombomere lengths of r3-5, (G) SI and (H) the DC number. Each represents 100 independent stochastic simulations for each convergence rate are based on the same parameters. Error bars represent standard deviation.
|