|
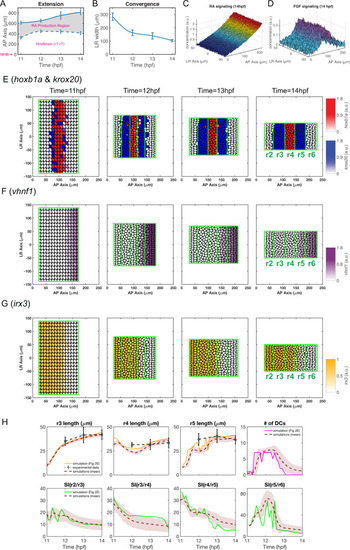
A baseline simulation mimics rhombomere boundary sharpening.(A,B) Experimental measurements of hindbrain dimensions along the A-P (A) and L-R (B) axes at 11, 12, 13 and 14 hpf. Error bars represent standard deviation. Cubic interpolation is used to obtain the smooth curves used in the model. (A) A-P hindbrain length was measured from the posterior edge of the mid-hindbrain boundary (MHB) to the anterior edge of the RA production region. A-P length of the RA production region was based on measurements of the aldh1a2 expression domain. (B) L-R hindbrain width was measured at the A-P position of r4. (C,D) Predicted noisy distributions of morphogen signaling at 14 hpf (C) RA ([RA]in). (D) FGF ([FGF]signal). (E-G) Time series of gene expression in r2-6 (the hindbrain is represented as a rectangle for simplification): (E)hoxb1a (red) and krox20 (blue), (F)vhnf1 (purple), (G)irx3 (yellow). (H) Quantifications of rhombomere length, number of dislocated cells (DCs) and sharpness indices (SIs) versus time. Rhombomere lengths (r3-5), and SIs for four boundaries (SI(r2/r3), SI(r3/r4), SI(r4/r5), SI(r5/r6)) and DC number in multiple simulations (n = 100): ‘solid line’: quantities for the simulation shown in (E); ‘brown dashed line’ indicates the average and the width of ‘brown shade” indicates standard deviation; ‘black dashed line’ represents rhombomere lengths from experimental measurements and the error bars represent standard deviation.
|