|
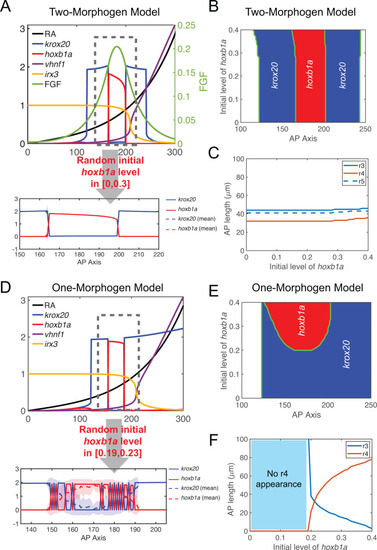
Comparing two-morphogen (RA, FGF) and one-morphogen (RA) models.(A-C) One-dimensional simulations for the two-morphogen model. (A) The upper panel shows spatial distributions of RA, krox20, hoxb1a, vhnf1, irx3 and FGF. The initial hoxb1a level is modeled as a constant 0.21 over the space. In the lower panel, the initial hoxb1a level is randomly sampled over the space independent of the location. The value is randomly uniformly distributed at a level of [0,0.3]. Solid line represents one simulation. Dashed line represents average values and the width of the shading around each line represents the standard deviation (n = 100). Since fluctuations over multiple simulations are small, solid lines overlap with dashed lines and the small standard deviations result in shadings of negligible width around the dashed lines. X-axis, microns; Y-axis, arbitrary units. (B) Phase diagram of hoxb1a and krox20 distributions with different initial hoxb1a levels. (C) Rhombomere lengths with different initial hoxb1a levels. (D-F) Similar one-dimensional simulations for the one-morphogen model. For (D), in the upper panel, the constant initial hoxb1a level is taken as 0.21; in the lower panel, the initial hoxb1a level is randomly sampled with levels in the range [0.19,0.23] with uniform distribution. Corresponding (E) phase diagram and (F) graph of rhombomere lengths with the one-morphogen model.
|