
Fig. 1
- ID
- ZDB-FIG-210714-1
- Publication
- Cirksena et al., 2021 - The C-mannosylome of human induced pluripotent stem cells implies a role for ADAMTS16 C-mannosylation in eye development
- Other Figures
- All Figure Page
- Back to All Figure Page
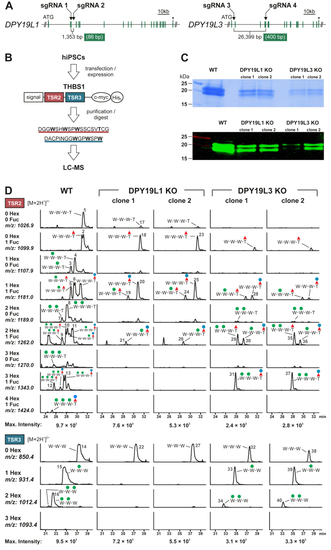
Deletion of DPY19L1 and DPY19L3 in hiPSCs.A, schemes of DPY19L1 and DPY19L3 genes indicating exons (green bars), sgRNA positions, stop codons (asterisks), and the number of total or exonic (green box) deleted base pairs. B, scheme of the THBS1 fragment expressed in WT, DPY19L1 KO, and DPY19L3 KO hiPSCs. The fragment contains two TSRs (TSR2 and TSR3) resulting in the indicated peptides upon AspN digestion. C, SDS-PAGE analysis of a purified THBS1 fragment secreted from WT, DPY19L1 KO, and DPY19L3 KO hiPSCs. Coomassie staining (upper panel) and Western blot (lower panel, anti-myc). D, MS analysis of a purified and AspN-digested THBS1 fragment secreted from WT, DPY19L1 KO, or DPY19L3 KO hiPSCs. For each mutant, two individual clones were analyzed. Extracted ion chromatograms (EICs) of the TSR2-derived (upper panels) or TSR3-derived (lower panels) peptides ([M + H+]2+) with different numbers of hexoses (Hex) and fucoses (Fuc) are displayed. Corresponding spectra of each sample were adjusted to the intensity of the most intense glycoform (maximum intensity, as indicated at the bottom). Annotation of peaks was based on the parental ion mass, RT, and fragmentation spectra. Numbers 1 to 40 refer to the fragmentation spectra of the respective peaks provided in supplemental Figure S4. For each peptide, only tryptophan (W) and threonine (T) residues are depicted, with respective C-mannoses (green circles) or O-fucose (red triangles) ± glucose (blue circles). hiPSCs, human induced pluripotent stem cells; RT, retention time; sgRNA, single-guide RNA; THBS1, thrombospondin 1; TSR, thrombospondin type 1 repeat. |