
- Title
-
The C-mannosylome of human induced pluripotent stem cells implies a role for ADAMTS16 C-mannosylation in eye development
- Authors
- Cirksena, K., Hütte, H.J., Shcherbakova, A., Thumberger, T., Sakson, R., Weiss, S., Jensen, L.R., Friedrich, A., Todt, D., Kuss, A.W., Ruppert, T., Wittbrodt, J., Bakker, H., Buettner, F.F.R.
- Source
- Full text @ Mol. Cell. Proteomics
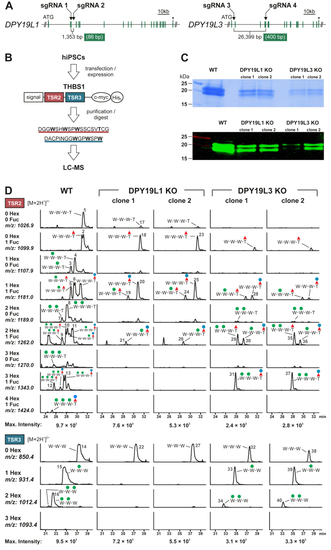
Deletion of DPY19L1 and DPY19L3 in hiPSCs.A, schemes of DPY19L1 and DPY19L3 genes indicating exons (green bars), sgRNA positions, stop codons (asterisks), and the number of total or exonic (green box) deleted base pairs. B, scheme of the THBS1 fragment expressed in WT, DPY19L1 KO, and DPY19L3 KO hiPSCs. The fragment contains two TSRs (TSR2 and TSR3) resulting in the indicated peptides upon AspN digestion. C, SDS-PAGE analysis of a purified THBS1 fragment secreted from WT, DPY19L1 KO, and DPY19L3 KO hiPSCs. Coomassie staining (upper panel) and Western blot (lower panel, anti-myc). D, MS analysis of a purified and AspN-digested THBS1 fragment secreted from WT, DPY19L1 KO, or DPY19L3 KO hiPSCs. For each mutant, two individual clones were analyzed. Extracted ion chromatograms (EICs) of the TSR2-derived (upper panels) or TSR3-derived (lower panels) peptides ([M + H+]2+) with different numbers of hexoses (Hex) and fucoses (Fuc) are displayed. Corresponding spectra of each sample were adjusted to the intensity of the most intense glycoform (maximum intensity, as indicated at the bottom). Annotation of peaks was based on the parental ion mass, RT, and fragmentation spectra. Numbers 1 to 40 refer to the fragmentation spectra of the respective peaks provided in supplemental Figure S4. For each peptide, only tryptophan (W) and threonine (T) residues are depicted, with respective C-mannoses (green circles) or O-fucose (red triangles) ± glucose (blue circles). hiPSCs, human induced pluripotent stem cells; RT, retention time; sgRNA, single-guide RNA; THBS1, thrombospondin 1; TSR, thrombospondin type 1 repeat. |

TSR-containing proteins are reduced in cell culture supernatants of DPY19L1 KO and DPY19L3 KO hiPSCs. A, volcano plots displaying ratios of protein levels (fold change) detected in cell culture supernatants for DPY19L1 KO versus WT (left) and DPY19L3 KO versus WT (right). Significantly affected proteins with consensus sites for C-mannosylation are highlighted by blue (DPY19L1 KO) and red (DPY19L3 KO) dots, respectively. Dots above the horizontal line represent statistically significantly (p < 0.05, Student's t test) altered protein levels. B, enrichment of protein domains according to the Pfam database within the 25 proteins having consensus sites for C-mannosylation and showing significantly altered secretion in DPY19L1 KO and/or DPY19L3 KO hiPSCs (green bar, Fisher exact test, p ≤ 0.05). C, relative protein levels of 11 thrombospondin type 1 domain–containing proteins identified in the secretome of hiPSCs (WT, DPY19L1 KO, and DPY19L3 KO). Dots represent fold changes of protein levels in individual KO samples compared with the mean WT protein levels. The mean of individual fold changes for each KO is depicted by bars (blue bars for DPY19L1KO and red bars for DPY19L3 KO). Statistically significant fold changes are indicated by red asterisks. hiPSCs, human induced pluripotent stem cells; TSR, thrombospondin type 1 repeat. |
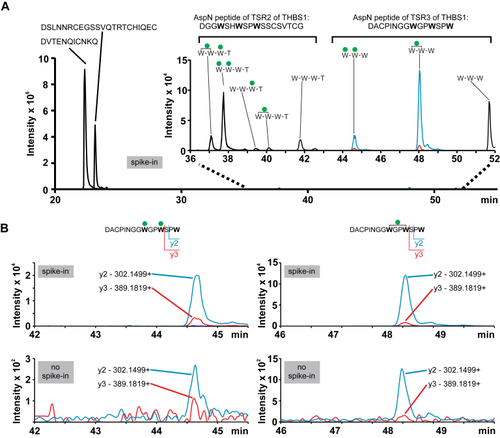
Endogenous THBS1 is C-mannosylated by hiPSCs.A, chromatographic separation and MRM monitoring of proteolytic peptides derived from a THBS1 fragment containing TSR1 to 3 (as shown in supplemental Fig. S2B) recombinantly expressed in HEK 293T cells. Peptides containing the consensus site for C-mannosylation (WxxW/C) with no, one, or two mannoses, elute noticeably later than the two other TSR-derived peptides and are detected at significantly lower signal intensities. B, EICs of characteristic fragment ions derived from the mono-C-mannosylated (right panels) and di-C-mannosylated (left panels) TSR3 peptide from hiPS cell culture supernatants containing recombinant THBS1 (upper panels) as a positive control (spike-in) are compared with native samples of hiPS cell culture supernatants without addition of THBS1 (lower panels). In the native samples (no spike-in), the corresponding C-mannosylated TSR3 peptides were detected with low intensities at expected elution times, confirming the presence of endogenous C-mannosylated THBS1 in hiPSC cell culture supernatants. EICs were transformed in Skyline using the Savitzky–Golay smoothing. EICs, extracted ion chromatograms; HEK, human embryonic kidney; hiPSCs, human induced pluripotent stem cells; MRM, multiple reaction monitoring; THBS1, thrombospondin 1; TSR, thrombospondin type 1 repeat. |
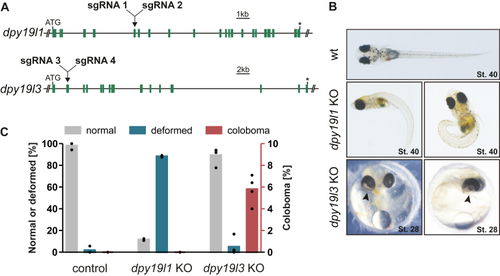
Targeting of dpy19l3 in medaka caused coloboma.A, schemes of dpy19l1 and dpy19l3 genes indicating exons (green bars), sgRNA positions, stop codons (asterisks). B, micrographs of medaka WT as well as dpy19l1 and dpy19l3 deletion mutants stage 40 and stage 28 of embryonic development grown at 28 °C. The gross of dpy19l1 mutants show caudal bending and shortening of anterior–posterior axis. A proportion of dpy19l3 mutants display defects in closure of the optic fissure, called coloboma (arrows). C, frequency of normal and deformed morphology as well as coloboma formation in medaka upon microinjection of GFP mRNA (control) or GFP mRNA in combination with sgRNAs targeting dpy19l1 or dpy19l3, respectively. Bars indicating normal (gray) and deformed (blue) morphology refer to the left y-axis, bars for coloboma formation (red) refer to right y-axis. Results of individual injection experiments are represented by dots. sgRNA, single-guide RNA. |
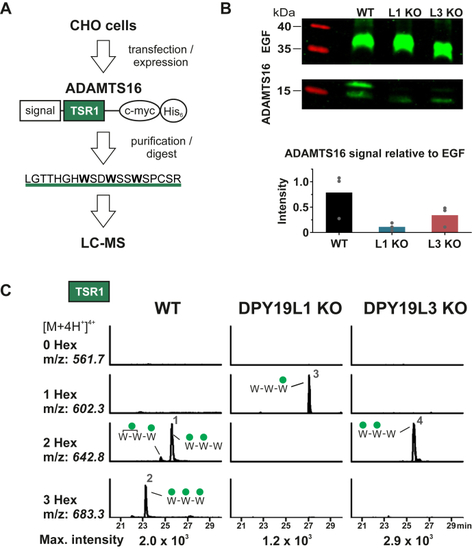
ADAMTS16 is C-mannosylated by DPY19L1 and DPY19L3.A, scheme of the ADAMTS16 fragment expressed in WT, DPY19L1 KO, and DPY19L3 KO CHO-K1 cells. The fragment contains TSR1 of ADAMTS16 resulting in the indicated peptides upon tryptic digestion. B, Western blot of the TSR1-containing ADAMTS16 fragment secreted by WT and KO cells. Coexpression of a myc-tagged fragment of mouse Notch1 comprising EGF repeats 9–14 served as transfection and secretion control. The amount of secreted ADAMTS16 relative to secreted EGF is depicted in the bar graph; results of individual experiments are represented by dots. C, MS analysis of a tryptic digest of the purified ADAMTS16 fragment secreted from WT, DPY19L1 KO, or DPY19L3 KO CHO-K1 cells. Extracted ion chromatograms (EICs) of the TSR1-derived peptides ([M + H+]4+) with different numbers of hexoses (Hex) are displayed. Corresponding spectra of each sample were adjusted to the intensity of the most intense glycoform (maximum intensity, as indicated at the bottom). Annotation of peaks was based on the parental ion mass, RT, and fragmentation spectra. Numbers 1 to 4 refer to the fragmentation spectra of the respective peaks provided in supplemental Figure S5. For each peptide, only tryptophan (W) residues are depicted, with respective C-mannoses (green circles). ADAMTS, A Disintegrin And Metalloproteinase with ThromboSpondin motifs; EGF, epidermal growth factor; RT, retention time; TSR, thrombospondin type 1 repeat. |