
Fig. 5
- ID
- ZDB-FIG-210612-14
- Publication
- Holler et al., 2021 - Spatio-temporal mRNA tracking in the early zebrafish embryo
- Other Figures
- All Figure Page
- Back to All Figure Page
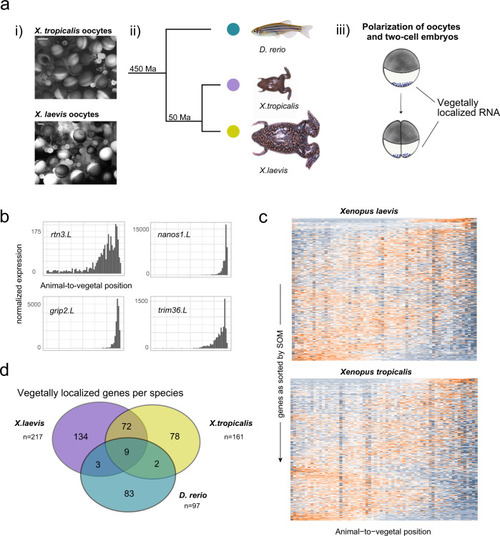
a (i) Light microscopy view of whole oocyte lobes from X. laevis and X. tropicalis before dissociation for one of the two replicates. Scale bar are 500 µm. (ii) Phylogenetic distance of Xenopus species and zebrafish as described in ref. 74 (Ma: million years). (iii) Deposition of germ plasm and dorsal factors (as purple dots) in Xenopus oocytes and after first cell division. b Tomo-seq tracks of vegetally localized genes rtn3.L, nanos1.L, grip2.L, and trim36.L in X. laevis. c Heatmap of z-score normalized expression per section in Xenopus oocytes. Genes on the y-axis as sorted into profiles 1–50 by SOM (self-organizing map), spatial position on the x-axis. d Overlap of vegetally localized genes in zebrafish and Xenopus species, considering only genes that were expressed in all three species at the respective developmental stage. |