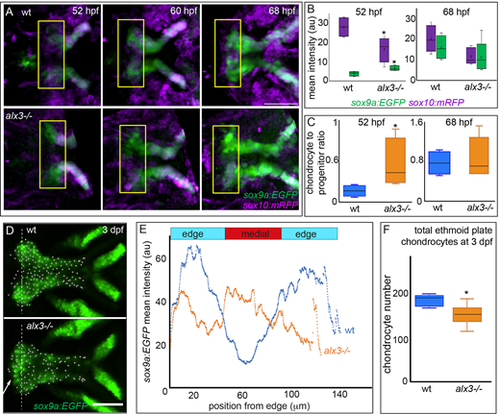
(A) Still frames from time-lapse recordings of chondrocyte differentiation in the ethmoid plate. Fluorescence associated with progenitor cells (sox10:mRFP) and chondrocytes (sox9a:EGFP) was quantified within the yellow boxed regions at the anterior end of the ethmoid plate. (B) During early chondrocyte differentiation, the signal associated with progenitors is significantly decreased whereas the signal associated with differentiated chondrocytes is significantly increased in alx3 mutants compared with wild types (*P<0.05; unpaired t-test, n=8). By 68 hpf the signal associated with both progenitors and chondrocytes are no longer significantly different between wild types and mutants. Time-lapse recordings from eight individuals with each genotype were quantified. (C) The data in B were used to calculate the ratio of differentiated chondrocytes to progenitor cells. At 52 hpf, this ratio is significantly higher in alx3 mutants compared with wild types; by 68 hpf the ratio is indistinguishable between mutants and wild types (*P<0.05; unpaired t-test, n=8). (D) sox9a:EGFP marks ethmoid plate chondrocytes. Arrow indicates increased chondrocytes near the midline in alx3 mutants compared with wild types. Dashed line indicates the vector used for the quantification in E, and dots are the automated calling of individual chondrocytes quantified in F. (E) Nine animals from each genotype were imaged as in D and the mean fluorescence along a vector was calculated and plotted versus the widest mediolateral distance across the anterior end of the ethmoid plate. Medial sox9a:EGFP fluorescence is significantly higher in alx3 mutants compared with wild types (Kruskal–Wallis). The total distance across the ethmoid plate was divided into thirds to determine the edge and medial regions of this skeletal element. (F) The total number of ethmoid plate chondrocytes was determined from the images used in E. There are significantly fewer chondrocytes in mutants (*P<0.005; unpaired t-test). For box plots, boxes represent the interquartile range, whiskers are the data range, the lines are the medians and x represents the mean. Scale bars: 50 µm.
|
