
Fig. 5
- ID
- ZDB-FIG-210504-20
- Publication
- Peng et al., 2020 - Induction of Wnt signaling antagonists and p21-activated kinase enhances cardiomyocyte proliferation during zebrafish heart regeneration
- Other Figures
- All Figure Page
- Back to All Figure Page
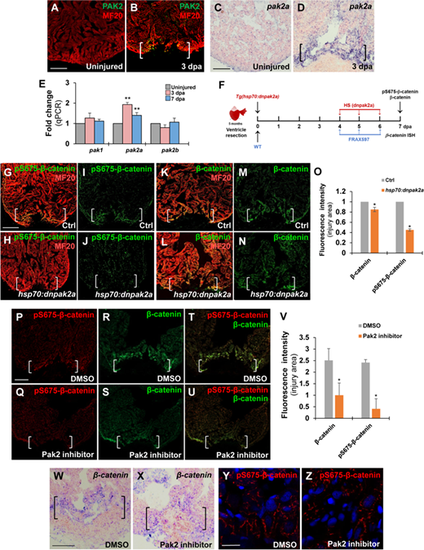
Inhibiting Pak2 activity using dominant-negative mutation or chemical inhibitor reduces pS675-β-catenin at wound edges in the regenerating heart. (A‒D) Immunostaining and ISH analyses displaying increased Pak2 and pak2a expression, respectively, at wounded myocardial cell edge in injured hearts at 3 dpa (B and D) compared to uninjured heart (A and C). Scale bar, 100 µm. (E) qPCR analysis for expression levels of pak1, pak2a, and pak2b in uninjured and resected WT hearts at 3 or 7 dpa. β-actin expression was used for normalization. Data are mean ± SEM from three biological replicates and three technical replicates. Student’s t-test, **P < 0.01. (F) Schematic showing heat shock experiment of Tg(hsp70:dnpak2a) and FRAX597 treatment for β-catenin and pS675-β-catenin assessment. Heat shock: 37°C for 2 h daily from 4 to 6 dpa. FRAX597: 1 µM (in DMSO) from 4 to 6 dpa. Control: 0.1% DMSO from 4 to 6 dpa. (G‒V) Confocal microscopy analyses for the levels of pS675-β-catenin and total β-catenin at wounded myocardial cell edges in hearts at 7 dpa. Scale bar, 100 µm. Data are mean ± SEM from five hearts for each group. Student’s t-test, *P < 0.05. (G‒O) pS675-β-catenin was diminished whereas total β-catenin was slight reduced in Tg(hsp:dnpak2a) hearts at 7 dpa. (P‒V) pS675-β-catenin was diminished and total β-catenin was reduced in the Pak2a inhibitor FRAX597-treated hearts at 7 dpa compared to 0.1% DMSO-treated control hearts. (T and U) Merged panels of P and R and Q and S, respectively. (W and X) ISH analysis showing the same β-catenin expression level in FRAX597-treated hearts (X) compared to DMSO-treated hearts (W). (Y and Z) Immunostaining analyses revealing a reduction of cytoplasmic pS675-β-catenin in FRAX597-treated hearts (Z) compared to DMSO-treated hearts (Y) at 7 dpa. Scale bar, 10 µm. |