
Fig. 2
- ID
- ZDB-FIG-210504-17
- Publication
- Peng et al., 2020 - Induction of Wnt signaling antagonists and p21-activated kinase enhances cardiomyocyte proliferation during zebrafish heart regeneration
- Other Figures
- All Figure Page
- Back to All Figure Page
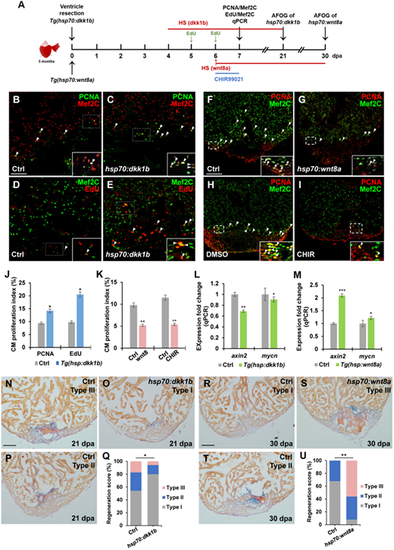
Suppression of Wnt signaling enhances heart regeneration by increasing CM proliferation. (A) Schematic of heat shock experiments and Wnt agonist treatment for CM proliferation, qPCR, and AFOG analyses. Heat shock (HS): 37°C for 2 h for control and Tg(hsp70:dkk1b) animals at 4, 5, and 6 dpa for PCNA/Mef2C assay or over the time period from 4 to 21 dpa for AFOG analysis; 37°C for 4 h for control and Tg(hsp70:wnt8a) animals at 6 dpa for PCNA/Mef2C assay or over the time period from 6 to 30 dpa for AFOG analysis. EdU: injection at 5 and 6 dpa. CHIR99021: 20 µM (in DMSO) from 6 to 7 dpa. Control: 0.1% DMSO from 6 to 7 dpa. (B‒I) Confocal microscopy analyses for CM proliferation. Insets show high-magnification images in rectangles. Scale bar, 100 µm. Data are mean ± SEM from five hearts each. Student’s t-test, *P < 0.05, **P < 0.01. (B‒E and J) Confocal images of PCNA+Mef2C+ (B and C) and EdU+Mef2C+ (D and E) cells (arrowheads) in heat-shocked WT (Ctrl) and Tg(hsp70:dkk1b) hearts following resection and PCNA- or EdU-labeled CM proliferation index (J). (F‒I and K) Confocal images of PCNA+Mef2C+ cells (arrowheads) in heat-shocked Ctrl (F) and Tg(hsp70:wnt8a) (G) hearts after amputation or 0.1% DMSO-treated (H) and CHIR99021-treated (I) WT hearts following resection and PCNA-labeled CM proliferation index (K). (L and M) qPCR analysis for relative expression levels of axin2 and mycn in wounded ventricles of Ctrl and Tg(hsp70:dkk1b) (L) or Tg(hsp70:wnt8a) (M) animals. β-actin expression was used for normalization. Data are mean ± SEM from three biological replicates and three technical replicates. Student’s t-test, *P < 0.05, **P < 0.01, ***P < 0.001. (N‒U) Representative images of AFOG-stained ventricle sections and regeneration scores. (N‒P and Q) Heat-shocked Ctrl and Tg(hsp70:dkk1b) animals at 21 dpa. (R‒T and U) Heat-shocked Ctrl and Tg(hsp70:wnt8a) animals at 30 dpa. Orange: muscle; blue: collagen; red: fibrin. Scale bar, 100 µm. Fisher’s exact test, *P < 0.05, **P < 0.01. |