
FIGURE

Figure 9

ID
ZDB-FIG-210420-33
Publication
Guilbeault et al., 2021 - BonZeb: open-source, modular software tools for high-resolution zebrafish tracking and analysis
Other Figures
All Figure Page
Back to All Figure Page
Figure 9

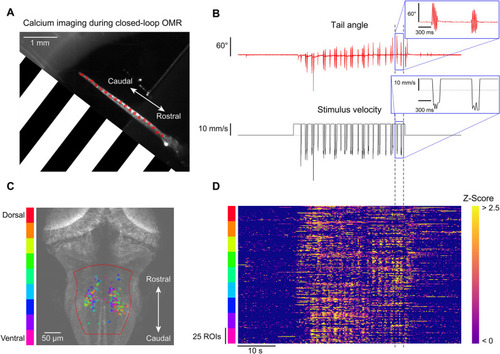
Calcium imaging during closed-loop OMR. One-dimensional closed-loop optomotor gratings were presented to a head-fixed larva while simultaneously performing fast volumetric two-photon calcium imaging. (A) Single frame obtained from the behavior camera showing the larva’s tail with the OMR stimulus represented (stimulus spatial frequency was lower than depicted; 450 Hz tracking). The OMR stimulus was presented from the side and travelled from caudal to rostral. (B) Tail angle and stimulus velocity across the entire 1-min trial. Movement of the closed-loop OMR stimulus began at 15 s and continued for 30 s. (C) Maximum intensity z-projection overlaid with neuronal ROIs found in the medial hindbrain. 25 ROIs were selected for each z-plane and color-coded by depth. Automated ROI extraction was performed throughout the region enclosed in dotted red line which helped minimize the detection of non-somatic ROIs. (D) Z-scored ROI responses across the trial.

Expression Data

Expression Detail
Antibody Labeling
Phenotype Data

Phenotype Detail
Acknowledgments
This image is the copyrighted work of the attributed author or publisher, and ZFIN has permission only to display this image to its users. Additional permissions should be obtained from the applicable author or publisher of the image. Full text @ Sci. Rep.