
Figure 8
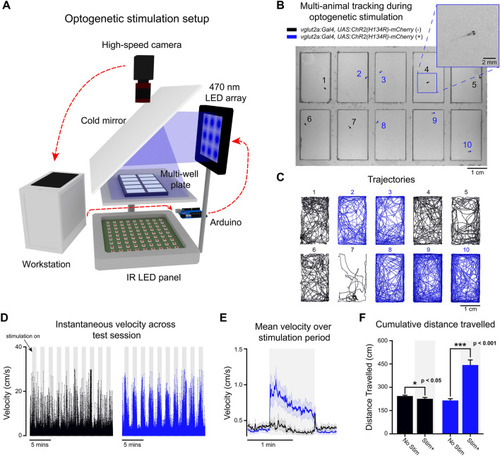
Free-swimming multi-animal tracking during optogenetic stimulation. Ten larvae were tracked simultaneously (200 Hz) in a multi-well plate while being subjected to epochs of optogenetic stimulation. (A) 3D schematic of the optogenetic stimulation setup. Live video is processed by BonZeb, which sends commands to an Arduino to generate a digital signal for triggering a 470 nm LED array (0.9 mW/mm2 at the plate). Components of the optogenetic setup are not to scale. (B) Example of a single video frame. Data are color coded based on genetic background. (C) Example of trajectories over an entire 20-min test session. (D) Instantaneous velocities for all fish plotted across the entire test session. Shaded regions represent periods when optogenetic stimulation occurred. 1-min intervals of stimulation and no stimulation repeated throughout the assay with a 30 s no stimulation period occurring at the beginning and end of the assay. Left: instantaneous velocity of control larvae (n = 15). Right: instantaneous velocity of experimental larvae (n = 15). (E) Mean instantaneous velocity averaged across all fish and all stimulation periods. Instantaneous velocity across each stimulation period was averaged for each fish and convolved with a box car filter over a 1s window. Bold line represents the mean and shaded region represents SEM. (F) Cumulative distance travelled during periods of stimulation ON (Stim +) and stimulation OFF (No stim). |