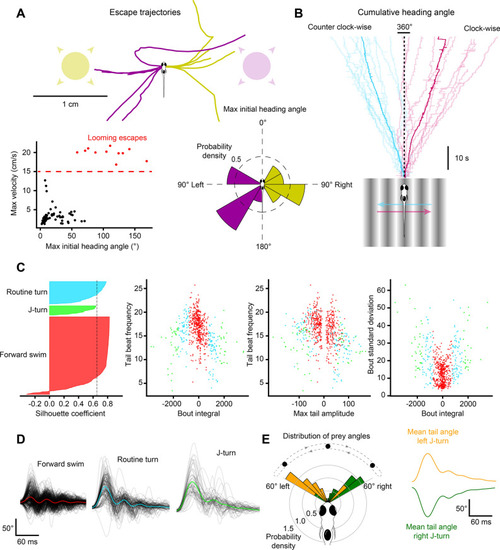
Visual stimulation drives specific behavioral kinematics. (A) Escape trajectories in the virtual open-loop looming dot assay when the looming dot was presented from the left (yellow) and from the right (magenta). Bottom left: max velocity (cm/s) with respect to the max initial heading angle (°) plotted for each bout. Bouts classified as escapes are colored red. Dashed red line represents the threshold value applied to the max velocity to select escape responses. Bottom right: probability density distribution for the max initial heading angle. (B) Cumulative heading angle over time in response to leftward (blue) and rightward (red) OMR stimulation. Spurious heading angle changes produced by fish interactions with the shallow edges of the watch glass have been removed. Rapid heading changes in the mean traces are due to the termination of shorter trials. (C) Hierarchical clustering applied to bouts in response to virtual open-loop prey stimulation. Four kinematics parameters were calculated for each bout (mean tail beat frequency, bout integral, max tail amplitude, bout standard deviation). Left: silhouette plot showing the results of hierarchical clustering with 3 clusters. Dotted line represents silhouette index. Middle-left to right: kinematic parameters plotted for each bout color-coded by cluster. (D) Black lines: tail angle over time for every bout in each cluster. Colored lines represent the mean tail angle over time across all bouts in each cluster. Results from (C,D) were used to identify the three clusters as forward swims (red), routine turns (blue), and J-turns (green). (E) Bouts in the J-turn cluster were separated into left-biased and right-biased swims. Left: probability density distribution of prey yaw angles at the start of left-biased and right-biased swims in the J-turn cluster. Right: mean tail angle over time for left (yellow) and right (green) J-turns.
|
