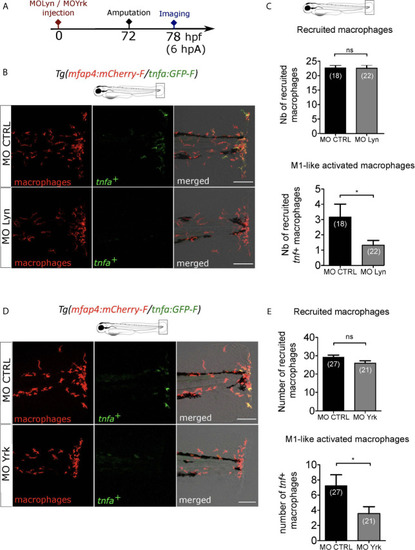
Macrophage-expressed SFKs Lyn and Yrk are enrolled in macrophage activation. (A) Schedule of the experiment. Morpholinos targeting specifically lyn (MO Lyn) or yrk (MO Yrk) or morpholino control (MO CTRL) were injected in Tg(mfap4:mCherry/tnfa:GFP-F) at one-cell stage. At 3 dpf, fin folds were amputated and larvae were imaged at 6 hpA using confocal microscopy. (B) Tail images are representative maximum projections of the fluorescence of mCherry-F (macrophages), GFP-F (tnfa+ cells) and merged channel images with brightfield at 6 hpA, after the injection of MO CTRL (up) or MO Lyn (down). Scale bar: 100 μm. (C) Quantification of recruited macrophages (up) and tnfa+ recruited macrophages (down) in controls and in Lyn morphants at 6 hpA. Two independent experiments merged, mean ± SEM, nlarvae is indicated in brackets, upper graph: two-tailed t-test, ns – not significant, bottom graph: Mann Whitney test, two-tailed, *p<0.05. (D) Tail images are representative maximum projections of the fluorescence of mCherry-F (macrophages), GFP-F (tnfa+ cells) and merged channel images with brightfield at 6 hpA, after the injection of MO CTRL (up) or MO Yrk (down). Scale bar: 100 μm. (E) Quantification of recruited macrophages (up) and tnfa+ recruited macrophages (down) in controls and in yrk morphants at 6 hpA. Two independent experiments merged, mean ± SEM, nlarvae is indicated in brackets, two-tailed t-test, ns – not significant, *p<0.05.
|
