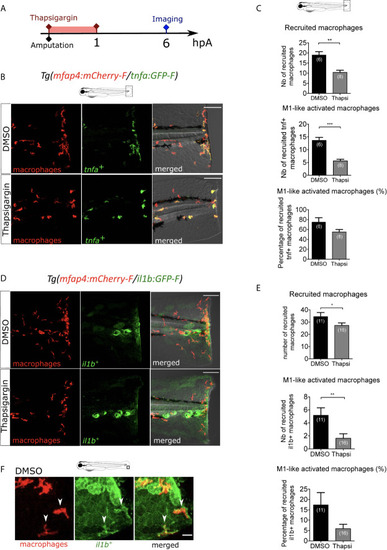
Intracellular Ca2+ signaling mediates macrophage recruitment and activation. (A) Schedule of the experiment. Immediately after the fin fold amputation at 3 dpf, Tg(mfap4:mCherry-F/tnfa:GFP-F) or Tg(mfap4:mCherry/il1b:GFP) larvae were treated with Thapsigargin or DMSO for 1 h. Thapsigargin was removed and larvae were imaged at 6 hours post amputation (hpA) using confocal microscopy. (B) Tail images are representative maximum projections of the fluorescence of mCherry-F (macrophages), GFP-F (tnfa+ cells) and merged channel images of Tg(mfap4:mCherry-F/tnfa:GFP-F) injured larvae, after the treatment with DMSO (up) or Thapsigargin (down) at 6 hpA. Scale bars: 100 μm. (C) Quantification of recruited macrophages (up) and tnfa+ recruited macrophages (middle) after the DMSO and Thapsigargin treatments at 6 hpA. The lower graph represents the percentage of tnfa+ macrophages in the recruited population. Representative experiment of three independent experiments, mean ± SEM, nlarvae is indicated in brackets, Mann Whitney test, two-tailed, **p<0.01, ***p<0.001. (D) Tail images are representative maximum projections of the fluorescence of mCherry-F (macrophages), GFP-F (il1b+ cells) and merged channel images with brightfield of Tg(mfap4:mCherry/il1b:GFP) injured larvae after the treatment with DMSO (up) or Thapsigargin (down) at 6 hpA. Scale bars: 100 μm. (E) Quantification of recruited macrophages (up) and il1b+ recruited macrophages (middle) after the DMSO and Thapsigargin treatments at 6 hpA. The lower graph represents the percentage of il1b+ macrophages in the recruited population. Two independent experiments merged, mean ± SEM, nlarvae is indicated in brackets, one-tailed t-test with Welch’s correction, *p<0.05, **p<0.01. (F) Representative zoomed maximum projections of the fluorescence of mCherry-F (macrophages) and GFP-F (il1b+ cells) merge channels images in injured fin fold of Tg(mfap4:mCherry/il1b:GFP) at 6hpA after the treatment with DMSO. Arrow heads show the overlap between GFP and mCherry signal in macrophages. Scale bar: 20 μm.
|
