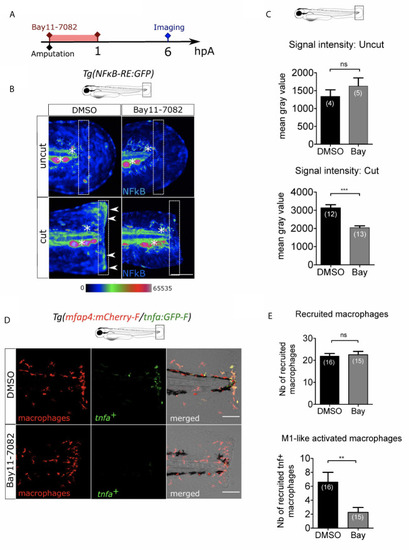
NFκB pathway is enrolled in macrophage activation after wounding. (A) Schedule of the experiment. Fin folds from Tg(NFκB-RE : GFP) or Tg(mfap4:mCh-F/tnfa:GFP-F) were amputated at 3 dpf and immediately treated either with DMSO or Bay11-7082 during 1 h. The drug was removed and larvae were imaged at 6 hpA using epi-fluorescent or confocal microscopy. (B) Representative images of the GFP fluorescence in uncut or cut fin folds from Tg(NFκB-RE : GFP) at 6 hpA, after the treatment with DMSO or Bay11-7082, detecting the NF-κB activation. Rainbow color scale was applied to images, emphasizing the differences in signal intensity. Asterisks show GFP signal in neuromast that is independent on NF-κB signaling. Arrow heads show NF-κB -dependent GFP signal at the wound edge. The white boxes outline the region of quantification. Scale bar: 100 μm. (C) Quantification of signal intensity of GFP fluorescence by mean gray value. Representative experiment of two independent experiments, mean ± SEM, nlarvae is indicated in brackets, upper graph: Mann Whitney test, two-tailed, bottom graph: one-tailed t-test, ***p<0.001. (D) Tail images are representative maximum projections of the fluorescence of mCherry-F (macrophages), GFP-F (tnfa+ cells) and merged channel images with brightfield of Tg(mfap4:mCh-F/tnfa:GFP-F) injured larvae after DMSO or Bay11-7082 treatment at 6 hpA. Scale bars: 100 μm. (E) Quantification of recruited macrophages (up) and tnfa+ recruited macrophages (middle) in controls and in DMSO or Bay11-7082 treated larvae at 6 hpA. Representative experiment of three independent experiments, mean ± SEM, nlarvae is indicated in brackets, upper graph: two-tailed t-test, ns – not significant, bottom graph: two-tailed t-test with Welch’s correction, **p<0.01.
|
