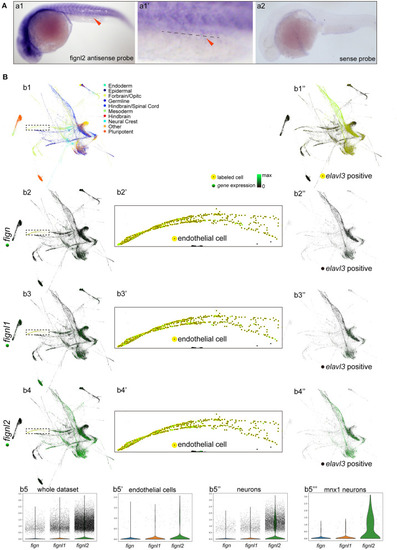
Expression of fign, fignl1, and fignl2 in zebrafish embryos. (A) Expression analysis of fignl2 using in situ hybridization. (a1) fignl2 expression is observed in the nervous system and somites at 24 hpf, and weak staining is also observed in caudal blood vessels (arrowhead) (Enlarged in a1′). (a2)in situ hybridization using a fignl2 sense probe as control. (B) Single-cell expression analysis of fign, fignl1, and fignl2 during zebrafish development (a re-analysis of GEO GSE112294). (b1) Single-cells in the dataset (4–24 hpf) are mapped to different tissues. (b2–b4) Expression of fign, fignl1, and fignl2 in the single-cell dataset. (b5) Violin plot of fign, fignl1, and fignl2 expression in the single-cell expression dataset of zebrafish embryos (4–24 hpf). (b2′-b4′) Expression of fign, fignl1, and fignl2 in endothelial cells (18 and 24 hpf). (b5′) Violin plot of fign, fignl1, and fignl2 expression in endothelial cells (18 and 24 hpf). (b1′′) Neuronal cells were isolated by elavl3 expression. (b2′′-b4′′) Expression of fign, fignl1, and fignl2 in elavl3-positive cells. (b5′′) Violin plot of fign, fignl1, and fignl2 expression in elavl3-positive cells. (b5′′′) Violin plot of fign, fignl1, and fignl2 expression in mnx1 positive cells. Expression data for violin plots are normalized and presented as counts per 104.
|
