
- Title
-
Microtubule Severing Protein Fignl2 Contributes to Endothelial and Neuronal Branching in Zebrafish Development
- Authors
- Dong, Z., Chen, X., Li, Y., Zhuo, R., Lai, X., Liu, M.
- Source
- Full text @ Front Cell Dev Biol
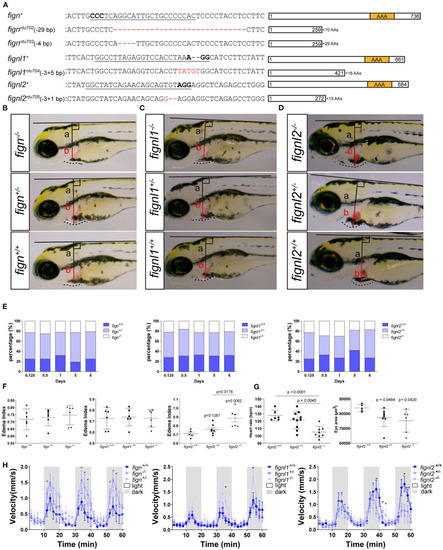
Loss of |
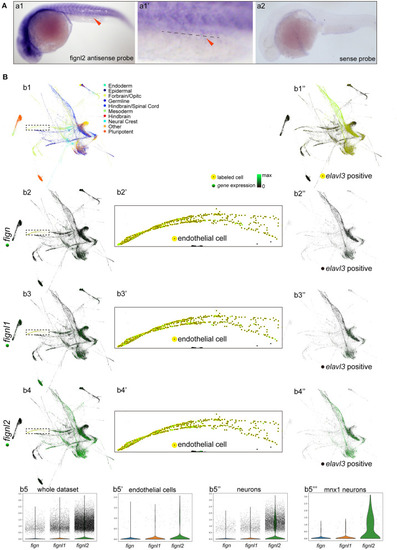
Expression of |
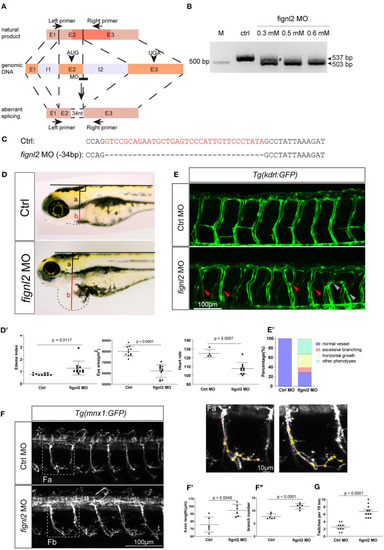
Depletion of |