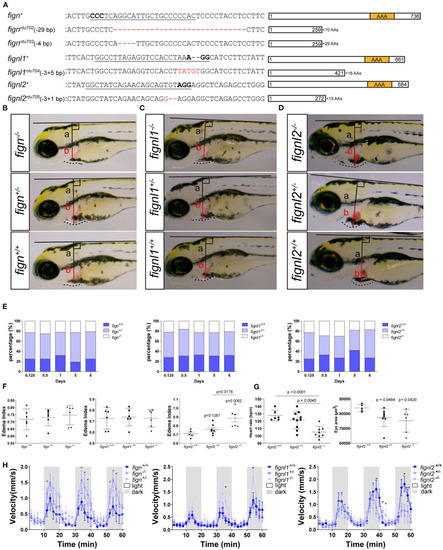
Loss of fignl2 leads to smaller eyes, pericardial edema, and reduced swimming velocity. (A) Mutated alleles generated using CRISPR/Cas9 lead to complete loss of the AAA-type ATPase domain. Underlined sequences are the CRISPR targets, wherein the bases in bold are the proto-spacer adjacent motifs (sequences are shown only on the sense strand). (B–D) Representative phenotype observation and edema index measurement in Fign mutants (B), Fignl1 mutants (C), and Fignl2 mutants (D) at 4 dpf. (E) Percentage of the filial embryos generated by crossing of fign+/ntu702 × fignl2+/ntu702, fignl1+/ntu704 × fignl2+/ntu704 and fignl2+/ntu705 × fignl2+/ntu705, showing partial embryonic lethality of fignl2 loss-of-function. Significance of differences compared to the wild type group is shown as p values on top of each dataset, and those between different mutant genotypes are shown on a horizontal line indicating groups used for comparison. (F) Statistics of pericardial edema index (PEI), n = (6,6,6) and (6,6,6) and (5,8,6); *p < 0.05, showing that the severity of edema was negatively correlated with functional fignl2 alleles. (G) Heart rate of the filial embryos generated by crossing of fignl2+/ntu705 × fignl2+/ntu705 showing abnormalities in the cardiovascular system in the fignl2 mutants, n = 6,10,8. Eyes of the filial embryos generated by crossing of fignl2+/ntu705 × fignl2+/ntu705 showing abnormalities in the cardiovascular system in the fignl2 mutants, n = 5,8,6. (H) Statistics of swimming velocity with 10-min light-dark cycle of fign, fignl1, and fignl2 mutants at 5 dpf, n = (12,25,9) and (14,22,11), and (20,19,9), showing weakened swimming ability of fignl2 mutants. Circles indicate a p < 0.1, asterisks (*) indicate a p < 0.05, and (**) indicates a p < 0.01, as indicated by the Student's t-test between the wild type and homozygous mutant groups.
|
