|
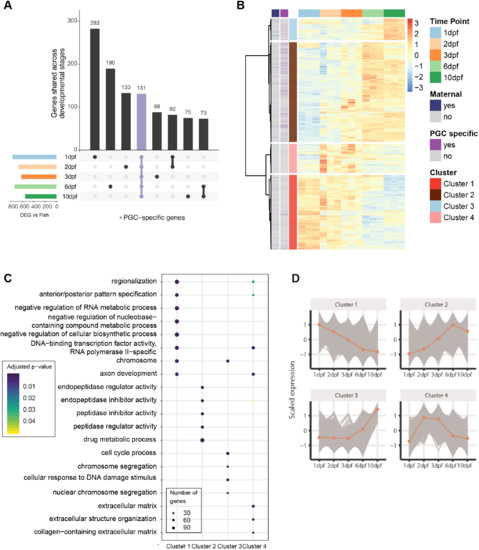
Gene expression analysis in PGCs. (A) UpSet plot of PGC-specific genes. The colored bar plot on the left represents the number of germline-enriched genes at indicated time points, determined by comparing with ‘whole fish’ at the same time point. The vertical bars represent the number of PGC-specific genes present at certain time points (dots) or at more than one time point (thick line). 131 genes are expressed at all five time points and enriched in the germline (purple; PGC-specific stable genes). (B) Hierarchical clustering of genes differentially expressed in the PGCs. Maternally provided annotation obtained from Aanes et al. (2011); PGC-specific genes, as defined by our own data, are indicated in the left two columns. (C) Gene ontology term enrichment of genes in the four different clusters. (D) Average scaled expression (z-score) of genes belonging to particular clusters.
|