|
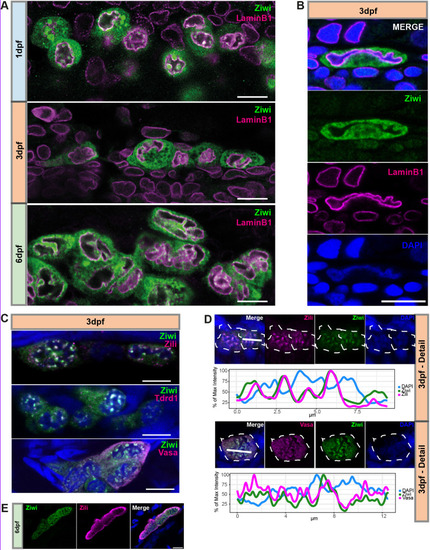
piRNA pathway components localize outside of gyrated nuclei. (A) Immunostaining for Ziwi (green) and LaminB1 (magenta) in PGCs at indicated time points. Scale bars: 10 µm. (B) A 3 dpf PGC with Ziwi (green), LaminB1 (magenta) and DAPI (blue). Scale bar: 10 µm. (C) Double immunostaining for colocalization of Ziwi and Zili, Tdrd1 and Vasa in PGCs at 3 dpf. Scale bars: 10 µm. (D) Colocalization analysis of Zili and Ziwi, and Ziwi and Vasa. Germ cells are indicated by the white dashed line. Blue staining is DAPI. Line plot of indicated selection for Ziwi and Zili (top) and Ziwi and Vasa (bottom) with DAPI. x-axis indicates the position along the indicated bar from left to right in µm; y-axis indicates percentage of maximum intensity. (E) Immunostaining of Ziwi and Zili at 6 dpf. Blue staining is DAPI. Scale bar: 10 µm.
|