|
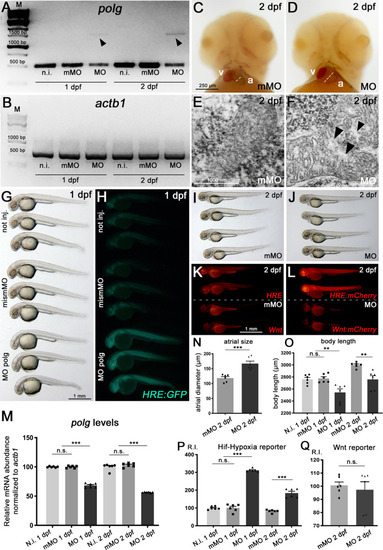
po<italic>lg</italic> morphants characterization and specific signalling pathway alteration.A, B Molecular validation of polg-specific morpholino oligos. Semi-quantitative RT-PCR from total cDNA of not injected (not inj), mismatched-morpholino (mismMO) injected controls and polg-specific morphants (MO), at 1 and 2 dpf, detects-specific alteration of polg transcripts. Arrowheads indicate altered cDNA products exclusively in polg morphant embryos (A). Control actb1 transcripts appear unaltered under all conditions (B). M marker. PCR experiments were performed in triplicate on cDNA samples derived from N = 30 whole embryos per condition. Quantifications are displayed in the (M) chart. C, D Cardiac dilation in polg morphants. Frontal views of control (C) and polg morphant (D) embryos at 2 dpf. Note the enlarged atrium in the morphant; a atrium, v ventricle. Atrial measurements are displayed in the (N) chart. E, F TEM analysis of mitochondria in the skeletal muscle of 2-dpf embryos: normal mitochondrial morphology in controls (E); fused and swollen mitochondria in morphants (altered areas indicated by black arrowheads (F). G–L Analysis of Hif-Hypoxia and Wnt signalling pathways under polg deficiency. Bright field (G, I, J) imaging shows a decreased body length, in the absence of overt dysmorphology, in 1 and 2-dpf morphant embryos; measurements are displayed in the (O) chart. Fluorescence (H, K, L) imaging of Hif-Hypoxia (HRE Hif-Hypoxia Responsive Elements) and Wnt signalling reporters shows strong activation of the Hif-Hypoxia pathway under polg-deficieny, in both green (H) and red (K, L) transgenic background. On the contrary, Wnt signalling appears unchanged (compare K with L). Relative intensity (R.I.) quantifications of the fluorescent signals are displayed in the (P) and (Q) charts. Statistical tests: one-way ANOVA followed by Tukey’s test; ***p < 0.0001; **p < 0.001; n.s. not significant; N = 6 samples per condition, in triplicate.
|