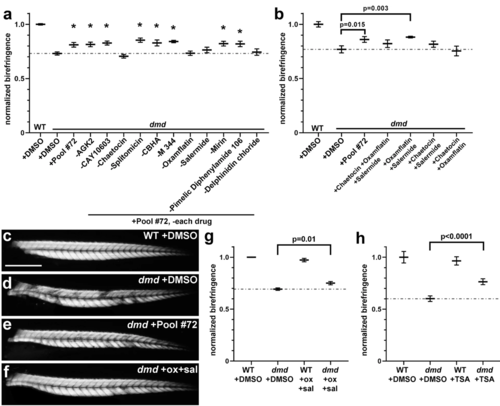
Oxamflatin and salermide mediate the effects of plate 2 row A. a Graph of average pixel intensities for treatments of zebrafish dmd mutants with pilot screen pool #72 and with pool #72 with each individual chemical removed. Control treatment is 1% DMSO. All chemicals included in the pools were tested at 1 μM. For each condition, 3 replicates of 25 embryos each were treated, with 2-9 dmd−/− embryos in each replicate. Plotted are the average normalized pixel intensities of the embryos from all 3 replicates for that treatment (n = 14-26 total dmd−/− embryos per treatment). Treatment with pool #72 without chaetocin, oxamflatin, salermide, or delphinidin chloride did not achieve the rescue effect seen with the full pool #72. The dashed line represents the average normalized pixel intensity for all of the DMSO-treated dmd animals (n = 26). Error bars represent standard error. Significance was determined using a one-way ANOVA test comparing each treatment group to the dmd DMSO control group with Dunnett’s correction for multiple comparisons. *p ≤ 0.04 compared to dmd DMSO control. b Graph of average normalized pixel intensities for treatments of dmd mutants with pool #72 and with combinations of chaetocin, oxamflatin, and salermide. Control treatment is 1% DMSO. All chemicals were used at 1 μM. For each treatment condition, n = 3 replicates, with 1-11 dmd−/− embryos in each replicate. Plot shows the average normalized pixel intensity for the 3 replicates for each treatment. The dashed line represents the average normalized pixel intensity for all of the DMSO-treated dmd animals (n = 14). Error bars represent standard error. Significance was determined using a one-way ANOVA test comparing each treatment group to the dmd DMSO control group with Dunnett’s correction for multiple comparisons. c-f 4 dpf zebrafish trunk muscle birefringence. Lateral views, anterior to the left. Representative animals are shown from treatments in (b). c WT + DMSO, d dmd + DMSO, e dmd + pool #72, and f dmd + oxamflatin and salermide. Scale bar = 500 μm. g Validation of oxamflatin and salermide treatment effects. Graph of average normalized pixel intensities for treatments of dmd fish with oxamflatin and salermide, performed in the Henry Lab. Treatments were performed from 1-4 dpf. Control treatment is 1% DMSO. Compounds were each used at 1 μM. Dashed line represents the average normalized pixel intensity for all of the DMSO-treated dmd−/− animals (n = 11). WT + DMSO, n = 10; WT + ox+sal, n = 9; dmd−/− + ox+sal, n = 14. Error bars represent standard error. p value determined by Student’s t test. h Validation of TSA treatment effects. Graph of average normalized pixel intensities for treatments of dmd fish with TSA, performed in the Henry Lab. Treatments were performed from 1-4 dpf. Control treatment is 1% DMSO. TSA was used at 200 nM. Dashed line represents the average normalized pixel intensity for all of the DMSO-treated dmd−/− animals (n = 31). WT + DMSO, n = 6; WT + TSA, n = 6; dmd−/− + TSA, n = 28. Error bars represent standard error. p value determined by Student’s t test
|
