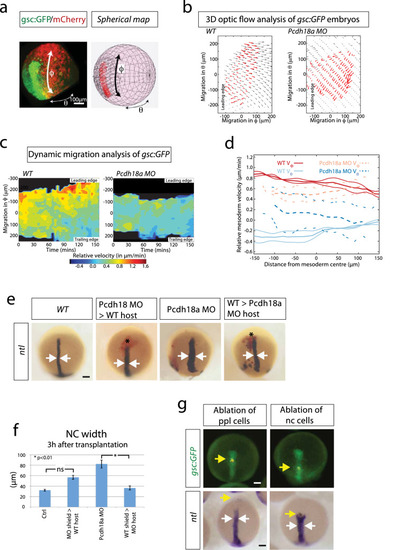
Analysis of the influence of the ppl on notochord morphogenesis. a–d 3D-optic flow analysis. a Spherical mapping of the optic flow of the fluorescent signal of a gsc:GFP/memCherry embryo onto a spherical coordinate system with θ as azimuth angle and ϕ as polar angle. b 2D Mercator projection of flow field of mesoderm (red arrows) compared with ectoderm above (black arrows). Both embryos analysed at 5 hpf. c The corresponding heat map kymograph shows the relative velocity of the mesoderm roughly every 5 min. d Thick solid (dashed) lines are smoothed average profiles of wild-type (WT; Pcdh18a deficient) embryos, with individual embryo profiles shown in lighter lines in ϕ (red/orange) and θ (light/dark blue) directions. epcdh18a MO donor shield was transplanted into WT hosts and vice versa. After 3 h, the embryos were fixed and subjected to ISH against ntl. Donor cells are marked in red. Arrows indicate the width of the notochord. f Quantifications display mean value, standard error of mean (SEM), and significance level of six independent embryos per experiment as indicated (*p value < 0.01; unpaired Student’s t test). g Ablation of cell rows in the ppl (5th GFP positive cell row) or at the ppl-notochord border (15th GFP positive cell row) in the Tg(gsc:GFP) fish line. Embryos were injected with a nuclear marker (Histone 2B-mCherry) and cell rows were ablated at 7 hpf using ultrashort laser pulses of a two-photon microscope. Embryos were raised to 10 hpf, fixed, and subjected to ISH against ntl. After ablation of a cell row in the ppl, embryos develop an elongated notochord (n = 11/11), whereas the notochord progenitor cells move slower and a gap appears towards the ppl in embryos with ablation of a cell row at the ppl–notochord border. Consequently, the trailing ntl expression domain remains shorter and broader (n = 6/10, white arrows). Yellow arrows mark the ablated cell rows. Scale bar: 100 µm
|
