|
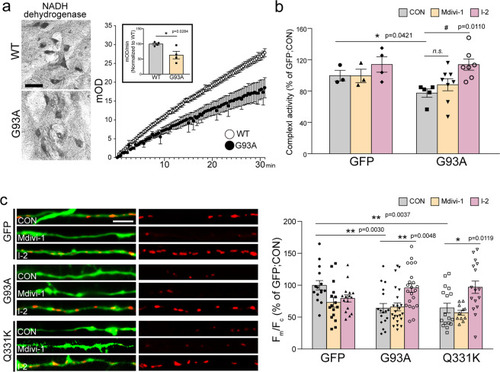
Effects of the blockade of PP1 on the complex I activity of mitochondria in the ALS model.a The histological image of NADH dehydrogenase activity and biochemical measurement of complex I activity on the MNs of the lumbar spinal cord in G93A and WT mice at 60 days of age. The inset graph shows the average of the complex I activity value. WT = 99.74 ± 3.83 (n = 4 mice), G93A = 62.9 ± 12.37 (n = 4 mice). Values are mean ± S.E.M. F(1,6) = 2.87, *P = 0.0284 by two-sided Student’s t-test. Scale bar, 100 μm. b The activity of mitochondrial complex I in primary cortical neurons cultured from WT and G93A mice following treatment with 25 µM Mdivi-1 or 80 nM I-2 for 72 h. WT:CON = 99.69 ± 6.81 (n = 3 independent primary culture), WT:Mdivi-1 = 99.37 ± 8.55 (n = 3 independent primary culture), WT:I-2 = 113.9 ± 9.12 (n = 4 independent primary culture), G93A:CON = 77.36 ± 5.33 (n = 5 independent primary culture), G93A:Mdivi-1 = 88.09 ± 7.70 (n = 8 independent primary culture), G93A:I-2 = 113.7 ± 7.09 (n = 7 independent primary culture). Values are mean ± S.E.M. F(1,6)=2.58, *P = 0.0421 for WT:CON versus G93A:CON by by two-sided Student’s t-test; F(2,17)=6.22, #P = 0.0110 for G93A:CON versus G93A:I-2, n.s. = not significant group by one-way ANOVA followed by Tukey’s multiple comparisons test. c The representative images and measurement of MMP in GFP+ primary cortical neurons following mALS gene transfection with 25 µM Mdivi-1 or 80 nM I-2 treatment for 72 h. GFP:CON = 1 ± 0.07 (n = 15 GFP+ primary cortical neurons), GFP:Mdivi-1 = 0.73 ± 0.08 (n = 16 GFP+ primary cortical neurons), GFP:I-2 = 0.92 ± 0.06 (n = 16 GFP+ primary cortical neurons), G93A:CON = 0.66 ± 0.06 (n = 23 GFP+ primary cortical neurons), G93A:Mdivi-1 = 0.64 ± 0.07 (n = 17 GFP+ primary cortical neurons), G93A:I-2 = 0.96 ± 0.07 (n = 22 GFP+ primary cortical neurons), Q331K:CON = 0.64 ± 0.07 (n = 17 GFP+ primary cortical neurons), Q331K:Mdivi-1 = 0.57 ± 0.04 (n = 11 GFP+ primary cortical neurons), Q331K:I-2 = 0.97 ± 0.10 (n = 16 GFP+ primary cortical neurons). Values are mean ± S.E.M. F(2,52) = 7.529, **P = 0.0030 for GFP:CON versus G93A:CON, **P = 0.0037 for GFP:CON versus Q331K:GFP; F(2,44) = 3.86, *P = 0.0268 for GFP:CON versus GFP:Mdivi-1; F(2,59) = 7.184, **P = 0.0048 for G93A:CON versus G93A:I-2; F(2,41) = 6.87, *P = 0.0119 for Q331K:CON versus Q331K:I-2 by one-way ANOVA followed by Tukey’s multiple comparisons test. Scale bar, 20 μm.
|