|
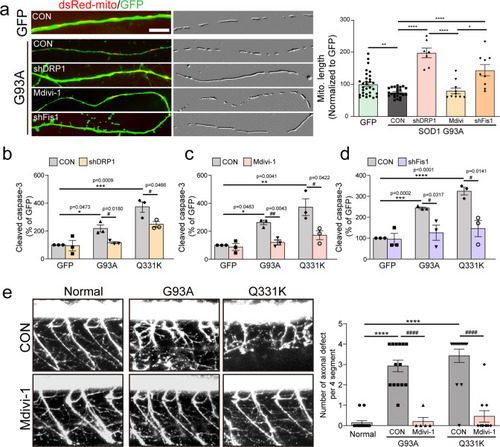
Effects of the blockade of Drp1 activity on ALS mutant-induced pathological features.Analysis of mitochondrial length ((a) N = 10 per group) and active caspase-3-positive neurons (b–d) after 3 days following shRNA co-transfection or 25 μM Mdivi-1 treatment with G93A or Q331K clone. Mitochondrial images have been embossed. GFP = 100.1 ± 6.54 (n = 31 GFP+ neurons), SOD G93A:CON = 74.55 ± 6.54 (n = 24 GFP+ neurons), SOD G93A:shDRP1 = 197.3 ± 14.96 (n = 7 GFP+ neurons), SOD G93A:Mdivi = 105.5 ± 8.79 (n = 10 GFP+ neurons), SOD G93A:shFis1 = 143.7 ± 17.38 (n = 9 GFP+ neurons). Values are mean ± S.E.M. F(1,53) = 3.239, **P = 0.0021 for GFP versus SOD G93A:CON by two-sided Student’s t-test. F(3,46) = 33.54, *P = 0.0440, ****P < 0.0001 by one-way ANOVA with Tukey’s post hoc analysis for multiple comparisons in (a). GFP:CON = 100 ± 0.00 (n = 3 independent primary cultures), GFP:shDRP1 = 95.25 ± 36.86 (n = 3 independent primary cultures), G93A:CON = 218 ± 25.18 (n = 3 independent primary cultures), G93A:shDRP1 = 116.4 ± 7.52 (n = 3 independent primary cultures), Q331K:CON = 370 ± 38.99 (n = 3 independent primary cultures), Q331K:shDRP1 = 247.6 ± 18.38 (n = 3 independent primary cultures). Values are mean ± S.E.M. F(2,6) = 25.58, *P = 0.0473, ***P = 0.009 by one-way ANOVA with Tukey’s post hoc analysis for multiple comparisons. F(1,4) = 0.1289, P = 0.9037 for GFP:CON versus GFP:shDRP1; F(1,4) = 3.869, #P = 0.0180 for G93A:CON versus G93A:shDRP1; F(1,4) = 2.846, #P = 0.0466 for Q331K:CON versus Q331K:shDRP1 by two-sided Student’s t-test in (b). GFP:CON = 99.98 ± 0.03 (n = three independent primary cultures), GFP:Mdivi-1 = 86.85 ± 24.57 (n = 3 independent primary cultures), G93A:CON = 257 ± 15.85 (n = 3 independent primary cultures), G93A: Mdivi-1 = 119.9 ± 17.42 (n = 3 independent primary cultures), Q331K:CON = 372 ± 60.06 (n = 3 independent primary cultures), Q331K: Mdivi-1 = 171.9 ± 32.03 (n = 3 independent primary cultures). Values are mean ± S.E.M. F(2,6)=14.53, *P = 0.0483, **P = 0.0041 by one-way ANOVA with Tukey’s post hoc analysis for multiple comparisons. F(1,4) = 0.5345, P = 0.6213 for GFP:CON versus GFP:shDRP1; F(1,4) = 5.819, ##P = 0.0043 for G93A:CON versus G93A:shDRP1; F(1,4) = 2.922, #P =0 .0422 for Q331K:CON versus Q331K:shDRP1 by two-sided Student’s t-test in (c). GFP:CON = 100 ± 0.03 (n = 3 independent primary cultures), GFP:shFis1 = 94.73 ± 27.67 (n = 3 independent primary cultures), G93A:CON = 244 ± 4.88 (n = 3 independent primary cultures), G93A:shFis1 = 125.8 ± 36.28 (n = 3 independent primary cultures), Q331K:CON = 324.9 ± 18.34 (n = 3 independent primary cultures), Q331K: shFis1 = 146 ± 38.89 (n = 3 independent primary cultures). Values are mean ± S.E.M. F(2,6) = 108.1, ***P = 0.0002, ****P < 0.0001 by one-way ANOVA with Tukey’s post hoc analysis for multiple comparisons. F(1,4) = 0.1922, P = 0.8569 for GFP:CON versus GFP:shDRP1; F(1,4) = 3.24, #P = 0.0317 for G93A:CON versus G93A:shDRP1; F(1,4) = 2.922, #P = 0.0141 for Q331K:CON versus Q331K:shDRP1 by two-sided Student’s t-test in (d). Scale bar, 5 μm. e Zebrafish expressing G93A and Q331 with 2.5 μM Mdivi-1 daily treatment over 2 days, and the number of axonal defects of MNs counted for each of the four segments. Normal = 0.14 ± 0.1 (n = 14 zebrafish), G93A:CON = 2.93 ± 0.29 (n = 14 zebrafish), G93A:Mdivi-1 = 0.2 ± 0.2 (n = 5 zebrafish), Q331K:CON = 3.43 ± 0.33 (n = 14 zebrafish), Q331K:Mdivi-1 = 0.45 ± 0.28 (n = 11 zebrafish). Values are mean ± S.E.M. F(2,39) = 47.44, ****P < 0.0001 by one-way ANOVA with Tukey’s post hoc analysis for multiple comparisons.; F(1,17) = 5.445, ####P < 0.0001 for G93A:CON versus G93A:Mdivi-1, F(1,23) = 6.671, ####P < 0.0001 for Q331K:CON versus Q331K: Mdivi-1 by two-sided Student’s t-test.
|