|
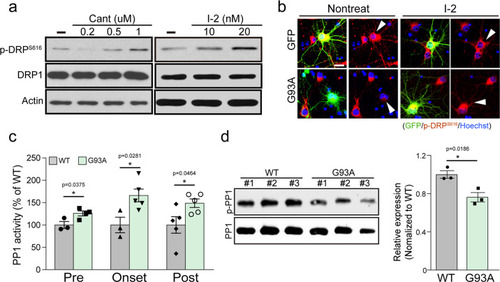
Dephosphorylation of the site S616 of Drp1 by PP1 and the increase in PP1 activity in the lumbar spinal cord of G93A mice.a Western blot analysis of p-Drp1 S616 and Drp1 expression level in primary cortical neuron with Cantharidin (for 1 h) or I-2 (for 1 day) treatment. b Representative immunostaining image of p-Drp1 S616 (red) in GFP+ primary cortical neuron with or without 80 nM I-2 treatment for 24 h. Arrowhead indicates the GFP-positive neuron. Scale bar, 20 μm. c PP1 activity in the lumbar spinal cord of G93A and WT mice at 60, 100, and 200 days of age. WT:Pre = 100 ± 7.79 (n = 3 mice), G93A:Pre = 125.9 ± 5.51 (n = 4 mice), WT:Onset = 100 ± 17.35 (n = 3 mice), G93A: Onset = 166 ± 14.32 (n = 5 mice), WT:Post = 100 ± 18.35 (n = 5 mice), G93A:Post = 148.7 ± 9.58 (n = 5 mice). Values are mean ± S.E.M. F(1,5) = 2.811, *P = 0.0375 for WT:Pre versus G93A:Pre; F(1,6) = 2.88, *P = 0.0281 for WT:Onset versus G93A:Onset; F(1,8) = .354, *P = 0.0464 for WT:Post versus G93A:Post by two-sided Student’s t-test. d Western blot analysis of p-PP1 and PP1 expression in the lumbar spinal cord of G93A and WT mice at the onset period. The graph shows the quantification of p-PP1 vs. PP1 intensity. WT = 1.00 ± 0.04 (n = 3 mice), G93A = 0.76 ± 0.05 (n = 3 mice). Values are mean ± S.E.M. F(1,4) = 3.832, *P = 0.0186 by two-sided Student’s t-test.
|