|
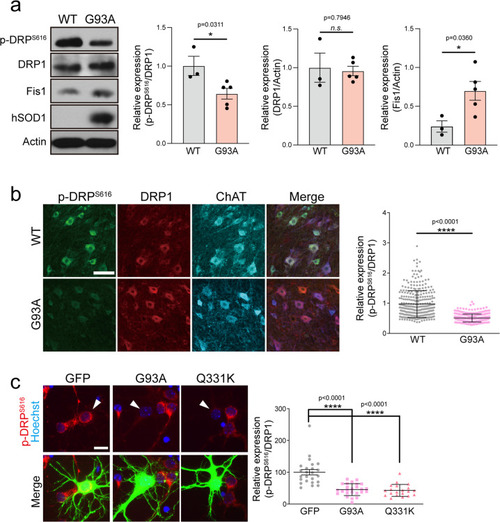
Reduction of Drp1 S616 phosphorylation in the SOD1 G93A model.a p-Drp1 S616 and Fis1 protein expression levels in the lumbar spinal cord of SOD1 G93A mice, and quantification of the relative expression of p-Drp1 S616 and Fis1, compared to WT. WT:p-DRPS616 = 1.00 ± 0.12 (n = 3 mice), G93A: p-DRPS616 = 0.64 ± 0.07 (n = 5 mice), WT:DRP1 = 1.00 ± 0.12 (n = 3 mice), G93A: DRP1 = 0.96 ± 0.06 (n = 5 mice), WT:Fis1 = 0.24 ± 0.07 (n = 3 mice), G93A: Fis1 = 0.70 ± 0.12 (n = 5 mice). Values are mean ± S.E.M. F(1,6) = 2.80, *P = 0.0311 for p-DRPS616; F(1,6) = 0.2721, P = 0.7946 for DRP1; F(1,6) = 2.691, *P = 0.0.0360 for Fis1 graph by two-sided Student’s t-test. n.s.: not significant. b p-Drp1 S616 immunostaining in the spinal MN of G93A and WT mice. The graph shows the ratio of intensity between p-Drp1 (green) and Drp1 (red) in ChAT-positive (blue; MN marker) neurons. WT = 1.56 ± 0.04 (n = 316 ChAT+ neurons), G93A = 0.81 ± 0.01 (n = 346 ChAT+ neurons. Values are mean ± S.E.M. F(1,660) = 18.4, ****P < 0.0001 by two-sided Student’s t-test. Scale bar, 100 μm. c Expression of p-Drp1 S616 in GFP-positive cortical neurons, following G93A or Q331K overexpression. The graph shows the quantification of p-Drp1 S616 intensity. Arrowhead indicates a GFP-positive neuron. GFP = 100.00 ± 8.40 (n = 24 GFP+ neurons), G93A = 45.30 ± 3.73 (n = 25 GFP+ neurons), Q331K = 42.95 ± 4.2 (n = 20 GFP+ neurons). Values are mean ± S.E.M. F(2,66) = 29.75, ****P < 0.0001 by one-way ANOVA with Tukey’s post hoc analysis for multiple comparisons. Scale bar, 20 μm.
|