|
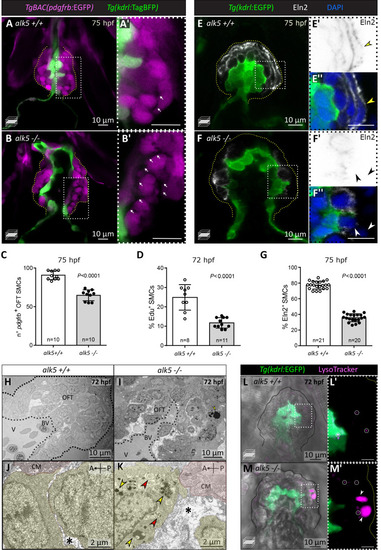
Alk5 regulates SMC and ECM organization in the cardiac OFT.(A–C) Confocal images (A–B’) and quantification (C) of SMCs in 75 hpf alk5+/+ and alk5-/- larvae. Magenta, SMCs; white arrows, extracellular space between SMCs; boxed areas are shown in A’ and B’; dotted lines outline the OFT. (D) Percentage of EdU+ SMCs in 72 hpf alk5+/+ and alk5-/- larvae. (E–F’’) Confocal images of 75 hpf alk5+/+ and alk5-/- larvae immunostained for Elastin2 (Eln2). White arrowheads, SMCs devoid of Eln2; yellow arrowheads, SMCs surrounded by Eln2 immunostaining; boxed areas shown in E’, E’’, F’ and F’’; images in E’ and F’ are shown with inverted colors; dotted lines outline the OFT. (G) Quantification of the percentage of SMCs surrounded by Eln2 immunostaining (per sagittal plane) at 75 hpf. (H–K) TEM images of 72 hpf alk5+/+ and alk5-/- mutant OFTs at different magnifications (n = 3 for each genotype). Yellow, SMCs; red, cardiomyocytes close to the BV canal; asterisks, extracellular space; arrows, electron-dense (yellow) and double-membraned (red) vacuoles; dotted lines outline the OFT. (L–M’) Confocal images of alk5+/+ (n = 5) and alk5-/- (n = 9) animals treated with LysoTracker, labeling lysosomes (small, circles; big, arrowheads); boxed areas are shown in L’ and M’; dotted lines outline the OFT. (C, D, G) Plot values represent means ± SD; p values from t-tests. A- anterior, P- posterior, BV- bulbo-ventricular canal, CM- cardiomyocyte. Scale bars: , (A-I, L–M’) 10 μm; (J, K) 2 μm.
|