|
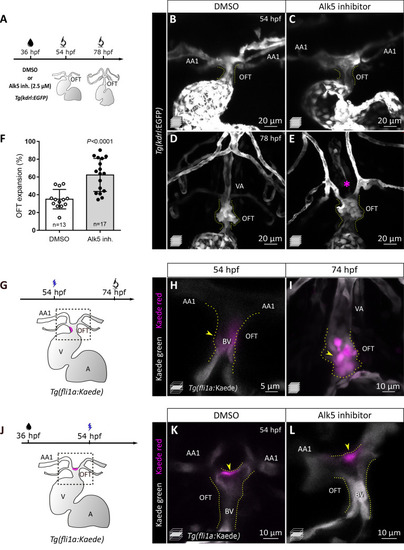
Phenocopy of <italic>alk5</italic> mutants by Alk5 inhibitor treatment.(A) Protocol used for Alk5 inhibitor treatments. (B–E) Confocal images of Tg(kdrl:EGFP) animals treated with DMSO or Alk5 inhibitor starting at 36 hpf and analyzed at 54 (B, n = 11; C, n = 11) or 78 (D, n = 13; E, n = 17) hpf. Asterisk, absence of the VA in Alk5 inhibitor-treated larvae. (F) Percentage of OFT expansion in 78 hpf control and Alk5 inhibitor-treated larvae; means ± SD; p value from t-test. For details about the quantifications, see Materials and methods ‘Defining the landmarks of the OFT’. (G) Schematics of the area photoconverted in H. (H, I) Confocal images of untreated photoconverted Tg(fli1a:Kaede) embryos at 54 (H, n = 5) and 74 (I, n = 5) hpf. (J) Schematics of the area photoconverted in K and L. (K, L) Confocal images of 54 hpf photoconverted Tg(fli1a:Kaede) DMSO (n = 9) or Alk5 inhibitor treated (n = 7) embryos. (H–L) Magenta, photoconverted ECs in the OFT (yellow arrowheads). (B–L) Dotted lines outline the OFT. (H, K, L) Single confocal planes. (B–E, I) Maximum intensity projections. AA1- 1° aortic arch, VA- ventral artery, BV- bulbo-ventricular canal. Scale bars: (B-E) 20 μm; (I–L) 10 μm; (H) 5 μm.
|