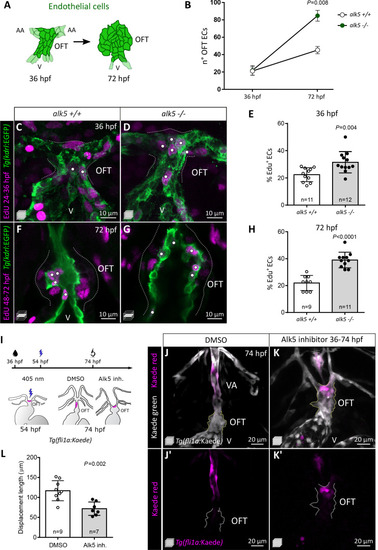
(A) Schematics of OFT ECs at 36 and 72 hpf. (B) Quantification of EC number (darker cells shown in A) in 36 and 72 hpf alk5+/+ and alk5-/- OFTs (36 hpf: n = 11; 72 hpf: n = 6). (C–H) Confocal images (C, D, F, G) and quantification (E, H) of the percentage of EdU+ ECs in Tg(kdrl:EGFP) alk5+/+ and alk5-/- OFTs. Dotted lines outline the OFT; white dots mark EdU+ ECs. All the other EdU+ cells in the OFT region are kdrl:EGFP-. (I) Protocol used for photoconversion experiment. (J–K’) Confocal images of the OFT in 74 hpf Tg(fli1a:Kaede) larvae treated with DMSO or Alk5 inhibitor. Magenta, photoconverted ECs; dotted lines outline the OFT. (L) Quantification of the distance covered by photoconverted ECs between 54 and 72 hpf in DMSO and Alk5 inhibitor-treated larvae. (C, D, J–K’) Maximum intensity projections. (F, G) Single confocal planes. (B, E, H, L) Plot values represent means ± SD; p values from t-tests (E, H) or Mann Whitney (B, L). Scale bars: (C-G) 10 μm; (J–K’) 20 μm. See also Figure 3—figure supplement 1.
|
